
This article will estimate the temperature effect by 2100 of the US emission reductions from a business-as-usual model for the effects of climate change. It will show that the reductions can be as much as 0.29 degrees F for the full 30% reduction by 2030, or 0.096 degrees F for the Clean Power Plan of 30% emissions reduction from the power sector.
The new Clean Power Plan’s rules to reduce CO2 from US power production by 30% by 2030 are being highly debated. The new rules are being denigrated by conservatives using a ubiquitous estimate that they will only reduce global warming by 0.018 degrees C by the end of this century. The Cato institute provides a calculator and a discussion of the source of that or alternate numbers on its website.
The calculations use a simplified climate model called MAGICC put forth by NCAR, the National Center for Atmospheric Research, and UCAR, the University Corporation for Atmospheric Research. It is centered around the A1B model of worldwide economic development and mitigation efforts until 2100. Hopefully, the world will follow something even better than this development, which although it has growth in yearly greenhouse gas outputs until 2040, it turns over there and outputs sharply reduced by the end of the century. The concentrations or radiative forcings keep increasing since CO2 lasts on the order of 100 years. However, you can argue that this heavily mitigated A1B model is not the best starting point for showing the effect of greenhouse gas reduction rules against a business-as-usual background that we are only starting to mitigate. Here, I will estimate the effect with a business-as-usual model.
The economic climate paths have been superseded by Representative Concentration Pathways (RCP) that just present courses of greenhouse gases or total radiative forcing during this century, without detailed economic and mitigation models. They are labeled by the ending radiative forcing at year 2100 in Watts per square meter. They are shown in the figure below.
Below is shown the CO2 equivalent concentrations including all forcing gases and effects for the four RCPs.
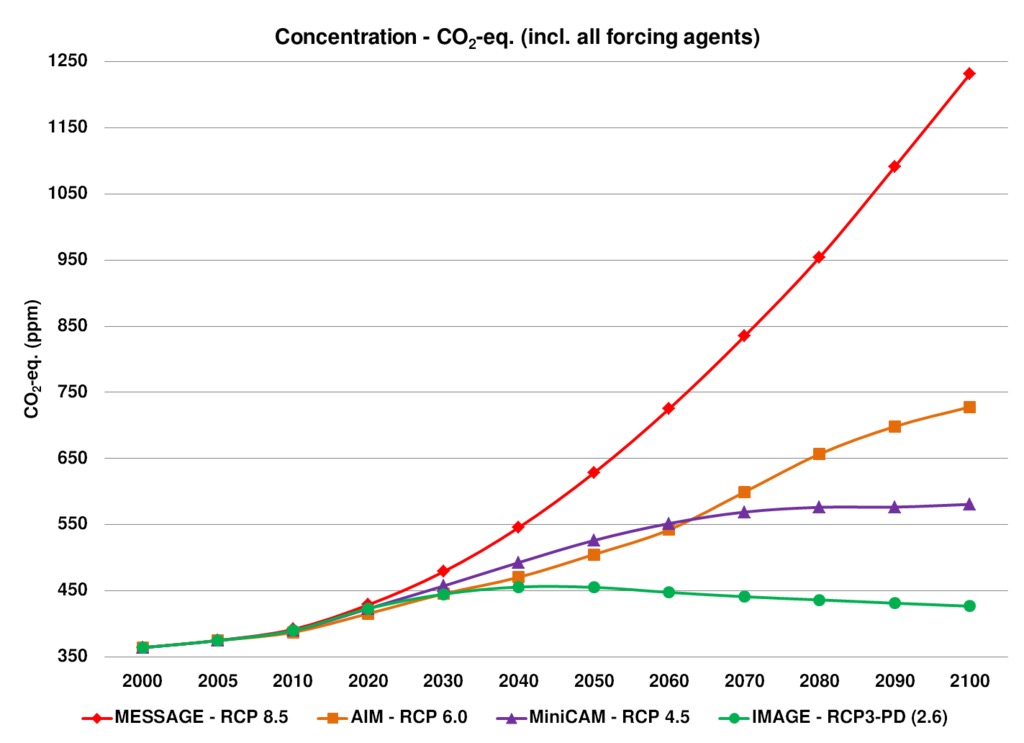
The one closest to A1B is RCP 6.0, with and ending temperature increase for 2081-2100 above the period 1986-2005, centered around 2.2 degrees C (4.0 F) over preindustrial times, with range from 1.4 to 3.1 degrees C. (To convert to the period 1850-1900 add 0.61 degree C.) The trajectory considered more as business as usual is RCP 8.5, which is the highest considered, and which we have already started tracking with our limited mitigation efforts. This has an ending temperature increase centered around 3.7 degrees C (6.7 degrees F), with a 90% inclusive range from 2.6 to 4.8 degrees C (4.7 to 8.6 F). I think it is more realistic to measure the effects of rules for GHG reduction from the starting trajectory of no reductions, than from an already highly mitigated trajectory. Thus I will use the RCP 8.5 trajectory.
The fraction of US GHG emissions in 2012 generated by the Electricity Sector is 32%. The CPP rules call for a 30% reduction of this by 2030. That would be a 9.6% reduction in total US emissions. (Coal results in 24.5% of total US emissions, and 44% of world emissions.) The US emitted 15% of worldwide emissions in 2012. Applying the 9.6% reduction to this gives a CPP reduction to worldwide emissions of 1.44%. Now that seems small in itself. However, the argument is made, if we, the richest large nation, does not make such an effort, how can we expect any other nations to do likewise.
Now the MAGICC calculations assume that we continue our same percentage emissions among the 90 OECD nations. Applying this to the world as a whole, even as other countries develop economically, we do also, maintaining the same percentage of emissions before reductions. Thus, of the final RCP warming trajectory, this will reduce the 2100 temperature increase by 1.44%. If we look at the RCP 8.5 increase centered around 3.7 degrees C, the Clean Power Plan rules would reduce it by 0.053 degrees C, or 0.096 degrees F. This is almost a factor of 3 greater than the standardly quoted 0.018 degrees C. This straightforward way of calculation removes a lot of the hidden modeling assumptions, but shows that different pictures can change such values by a factor of three.
The total US goal is to lower all emissions by 30% over 2005 emissions by 2030. Since that will now apply to triple the amount of emissions as the Electricity Sector alone, it could reduce century ending temperature by almost 0.16 degrees C, or 0.29 degrees F. Applying the 90% range from RCP 8.5 the overall US 30% reduction gives a range of 0.11 to 0.21 degrees C (0.20 to 0.38 F). Seen as part of a whole, the reduction from CPP gains greater significance.