
Here are graphs that show the extent of California’s four year drought.
California Snowpack
We start with the snowpack which is essential to supply water as it melts over the summer.
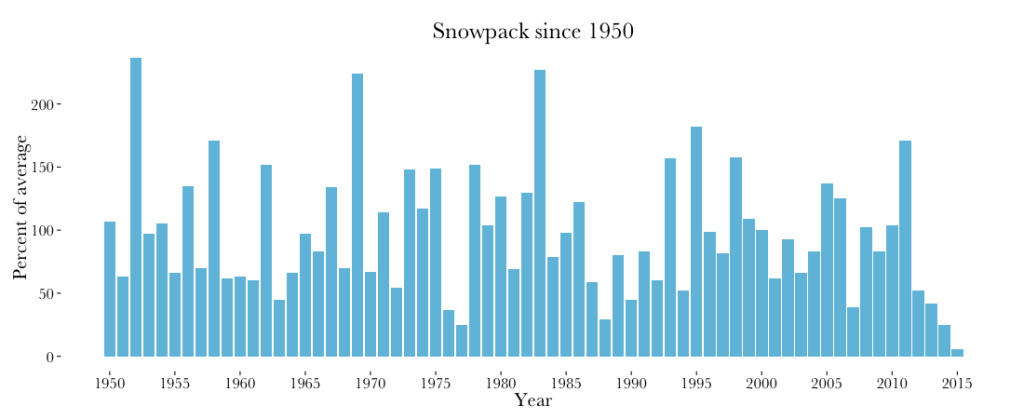
You can see that in 2012 and 2013 it was less than 50% of normal, and in 2014 and 2015 it is practically nil. Yet the graph also shows something hopeful. The length of periods around 50% or lower is generally just a few years. There was one drought before this period that did last nine years, however. So hopefully this one will end soon.
There is not an established opinion of climate scientists that this is caused by global warming. But there is a warm ocean “blob” off the coast of Oregon and Washington that has been around for two years, and may be causing the high pressure that diverts tropical storms, and warms the air over the Sierras to reduce snow. We’ll see if that persists.
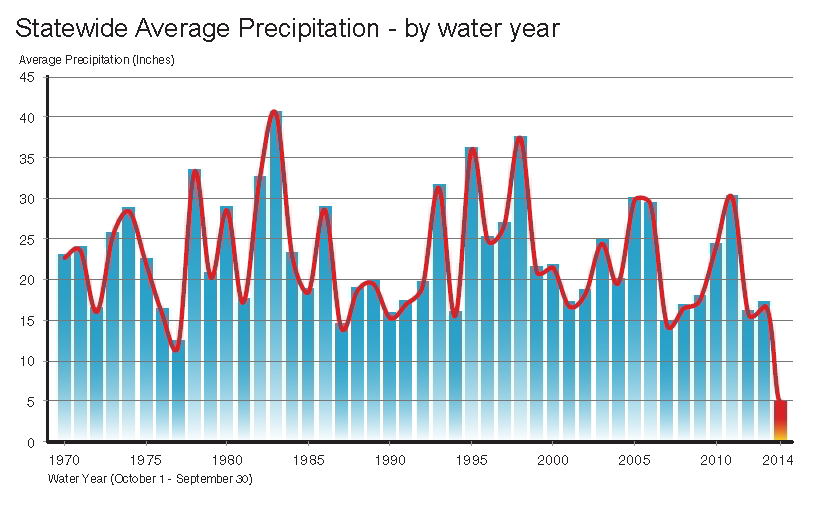
California Precipitation
California is expecting low total precipitation for the 2015 water year ending in Sept. 30, 2015.
Colorado River Water Measured as Inflow to Lake Powell
Since the Colorado River Aqueduct brings water to Southern California, we are concerned by drought in the Colorado Basin and Lake Powell Inflow. California gets 27% of Colorado River Water.

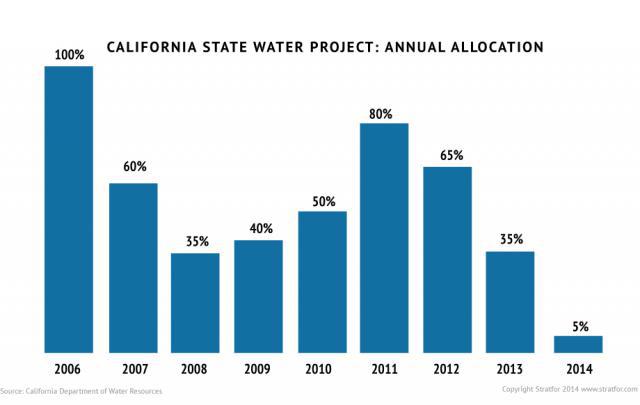
California State Water Project Allocations
We see that in 2013, the State Water Project Allocation was down to 35%, and in 2014, it was a mere 5%. For 2015, the allocation has risen to 20%. The State Water Project provides part of the water for 25 million Californians.
California Major Reservoir Current Conditions for April 28, 2015
The Orange shows the Reservoir Capacity in Thousands of Acre-Feet (TAF), the Blue the storage level on April 28. The Red line is the Historical Average level for all April 28ths.
Below the Reservoir is the percentage of total capacity in Blue, and the percentage of Historical Average for the date in Red. We see the three large Northern California Reservoirs are about 1/2 full, as well as San Luis and Don Pedro. The others are pretty low or of low capacity.
