
SC Edison 2014 Power Content Label – Compare and Contrast
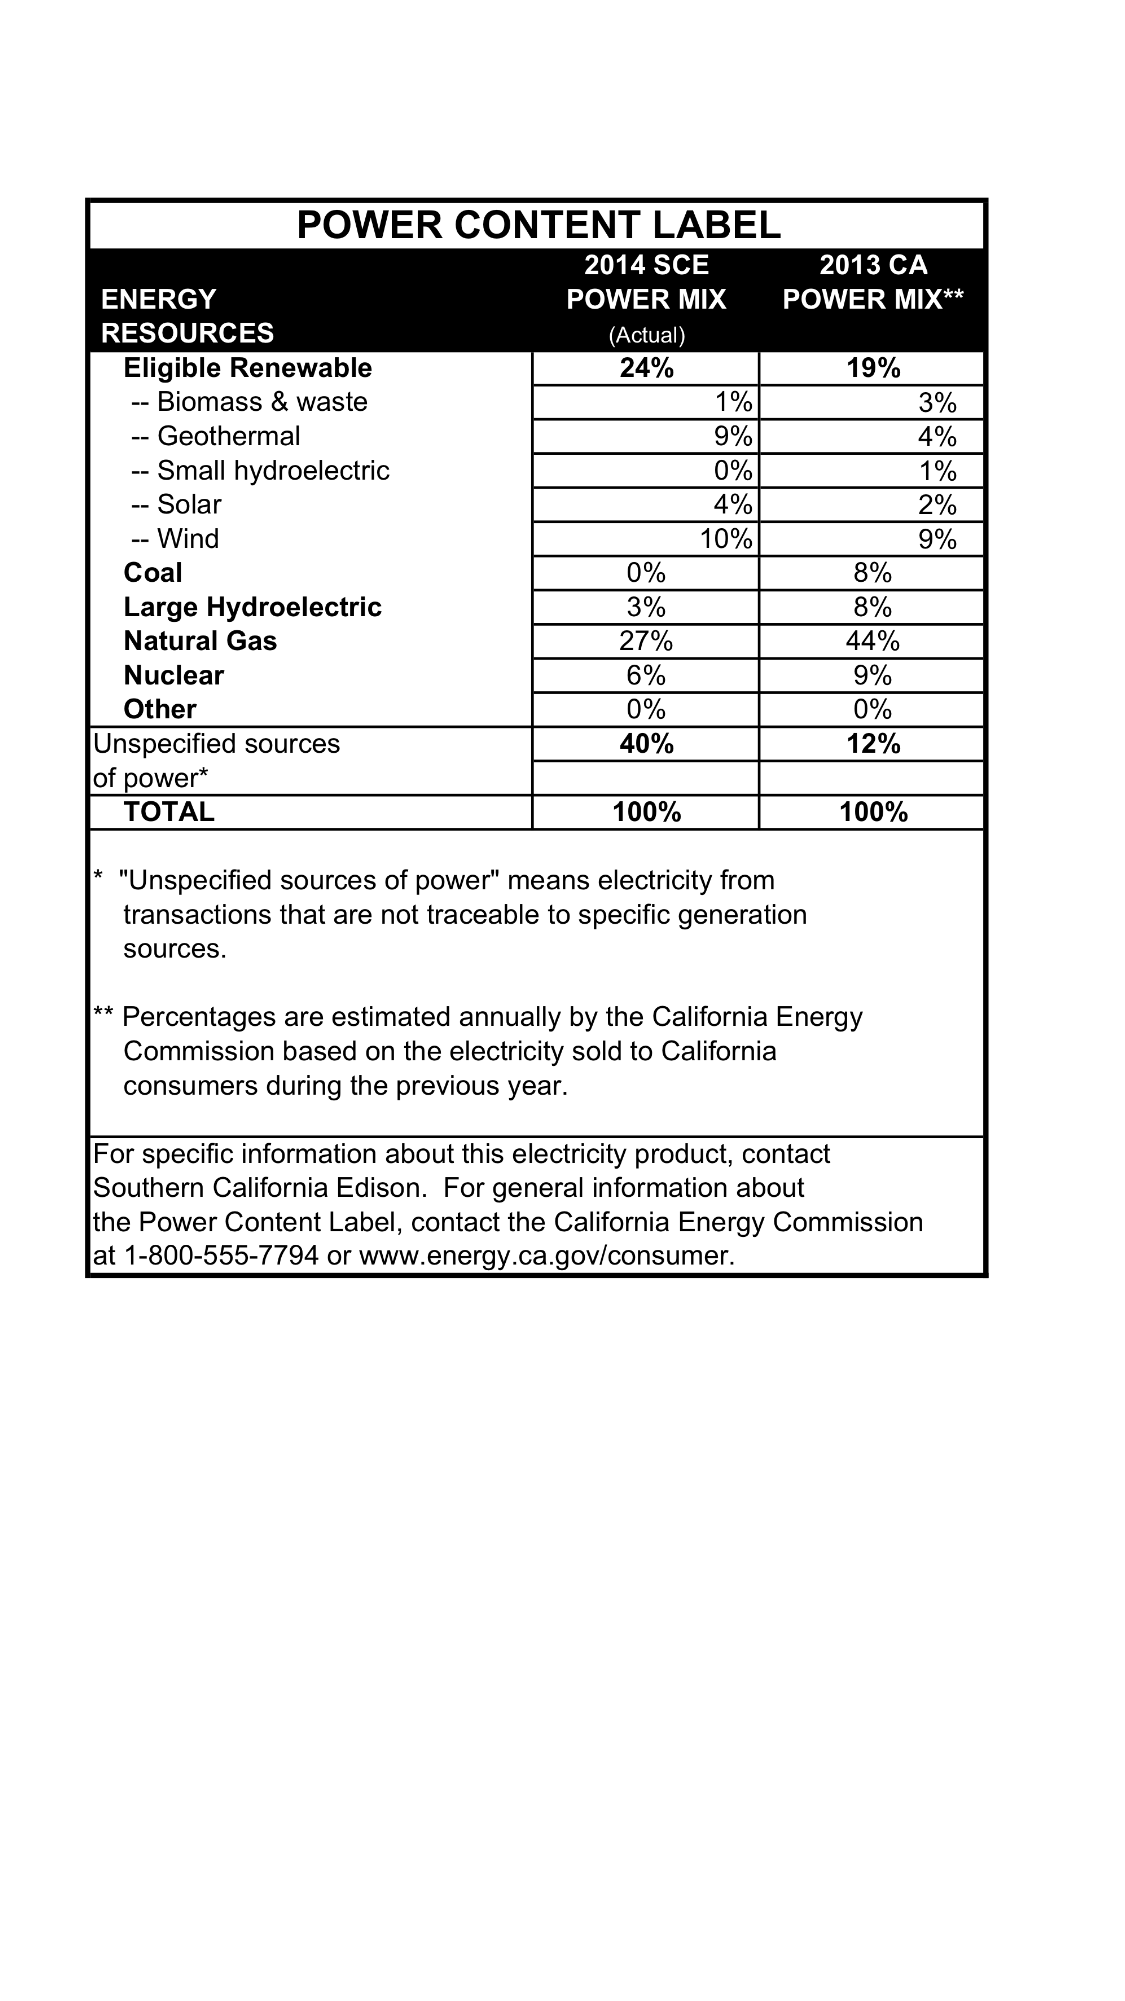
The SC Edison 2014 Power Content Label is now available on their website.
We compare this to past SC Edison Power Content Labels, shown in the graph below.
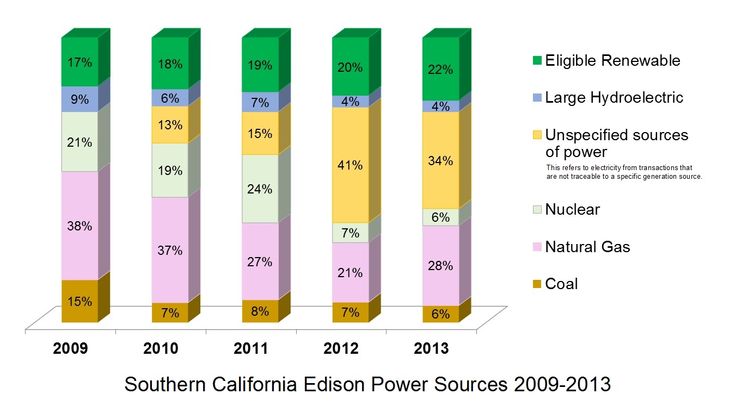
The San Onofre two nuclear reactors supplied 2.2 GigaWatts of power, before they were shut down because of faulty replacement heat exchangers. That was around the 20% of power that was nuclear in 2009—11. In 2014, nuclear power is down to 6%, probably from the Palo Verde nuclear reactor owned by SC Edison.
The Unspecified Sources of Power, which is out-of-state power, is 40% for 2014, comparable to 41% in 2012, and back up from 34% in 2013. The Southwest power out-of-state sources are said to be new combined cycle natural gas plants, and some coal.
Eligible Renewables is up to 24% in 2014, from 22% in 2013. This has been steadily rising from 17% in 2009. Wind is now the leading source, at 10%, geothermal is at 9%, and solar is at 4%.
Large Hydroelectric has fallen to 3% in 2014, down from 4% in 2013, and having fallen from 9% in 2009. This is probably mainly because of the four year drought.
The total clean energy sum of renewables, hydro, and nuclear is 33% in 2014. In the years in the graph, the clean energy sum is 47% (2009), 43% (2010), 50% (2011), 31% (2012), and 32% (2013). There is no use crying over spilled milk in the shutdown of San Onofre. But SC Edison was up to an amazing 50% of clean energy in 2011, and is now down at 33% but growing at 1% a year.
The California 2014 Energy Sources is on a federal energy site, and we relate its content below.

In comparing SC Edison’s Power Content Label with California’s 2014 label, we note that the 2014 California label is close to the 2013 label in the starting table. Coal and large hydro are down to 6%. Natural gas is at 45%, and nuclear is 9%.
Unspecified sources are at 15%, compared with SC Edison at 40%. The large amount of unspecified SC Edison power does not allow a calculation of the CO2 emission from the set of power sources.
California Renewables are 20%, composed of Wind at 8%, Geothermal and Solar at 4%, Biomass at 3% and Small Hydro at 1%.
The total of Clean Power is 35%, comparable to SC Edison at 33%.
SC Edison natural gas is at 27%, while California’s is at 45%. California Coal is at 6%, while SC Edison has none. Another problem with the current label occurs in figuring out the CO2 emissions from the power sources. The natural gas sources are not broken down by older single cycle plants at 33% efficiency, or new combined cycle gas turbine plants at 54% efficiency.