
Glacier dynamics
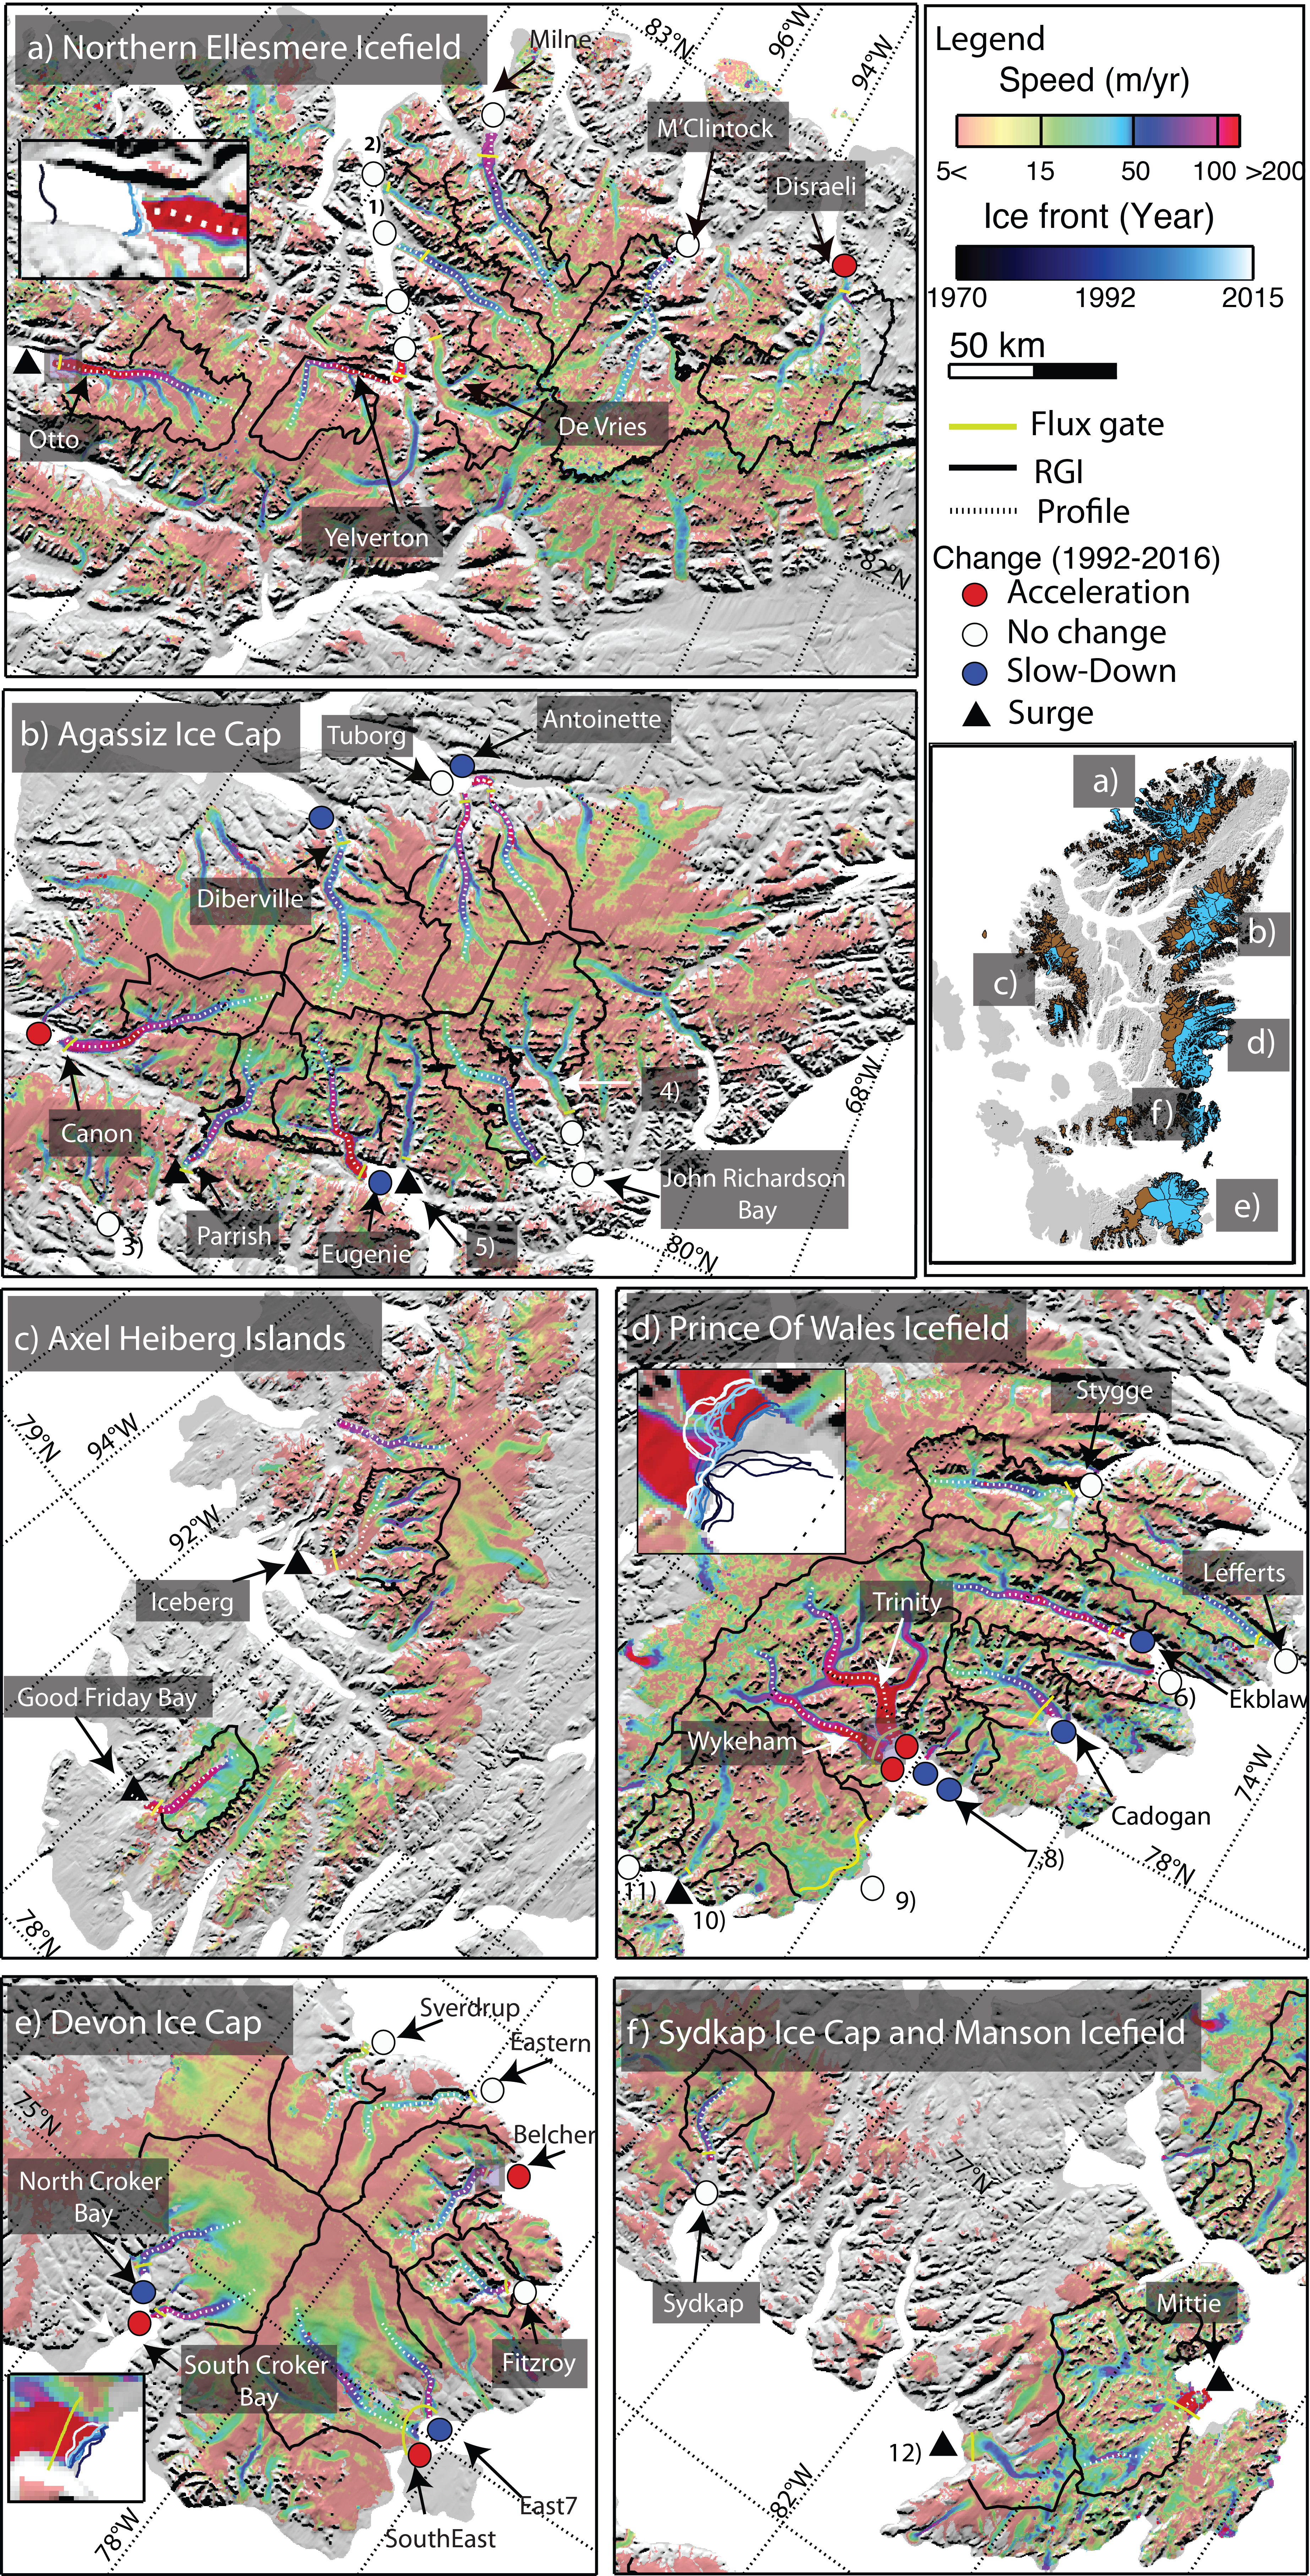
Flow speed of the QEI glaciers averaged between 1991 and 2015, color coded on a logarithmic scale, and overlaid on the CDED DEM in shaded relief. The survey domain is divided into 6 regions: (a) Northern Ellesmere Icefield, (b) Agassiz Ice Cap, (c) Axel Heiberg Islands, (d) Prince ofWales Icefield, (e) Devon Ice Cap, and (f) Sydkap Ice Cap and Manson Icefield. A full map of the QEI with CDED DEM in shaded relief is shown with the position of Nares Strait. Blue basins represent the drainage basins of marine terminating glaciers and brown basins represent the drainage basins of land-terminating glaciers. Operation IceBridge (OIB) flight tracks are yellow, center flow lines are dash white, flux gates are yellow, and Randolph Glacier Inventory basin boundaries are black. Insets in (a), (d) and (e) show ice front positions of marine-terminating glaciers color coded from black, to blue and white from 1970 to 2015 for (a) Otto Glacier, (d) Trinity and Wykeham glaciers, and (e) Belcher Glacier. Glacier names are provided for major outlet glaciers. Red circles denote glacier acceleration. White circles denote no change in speed. Blue circles denote a slow down in speed during the period 1992 to 2016. Surging glaciers during the 1991–2015 time period are denoted with a black triangle [Millan et al., 2017]
Bedrock topography mapping
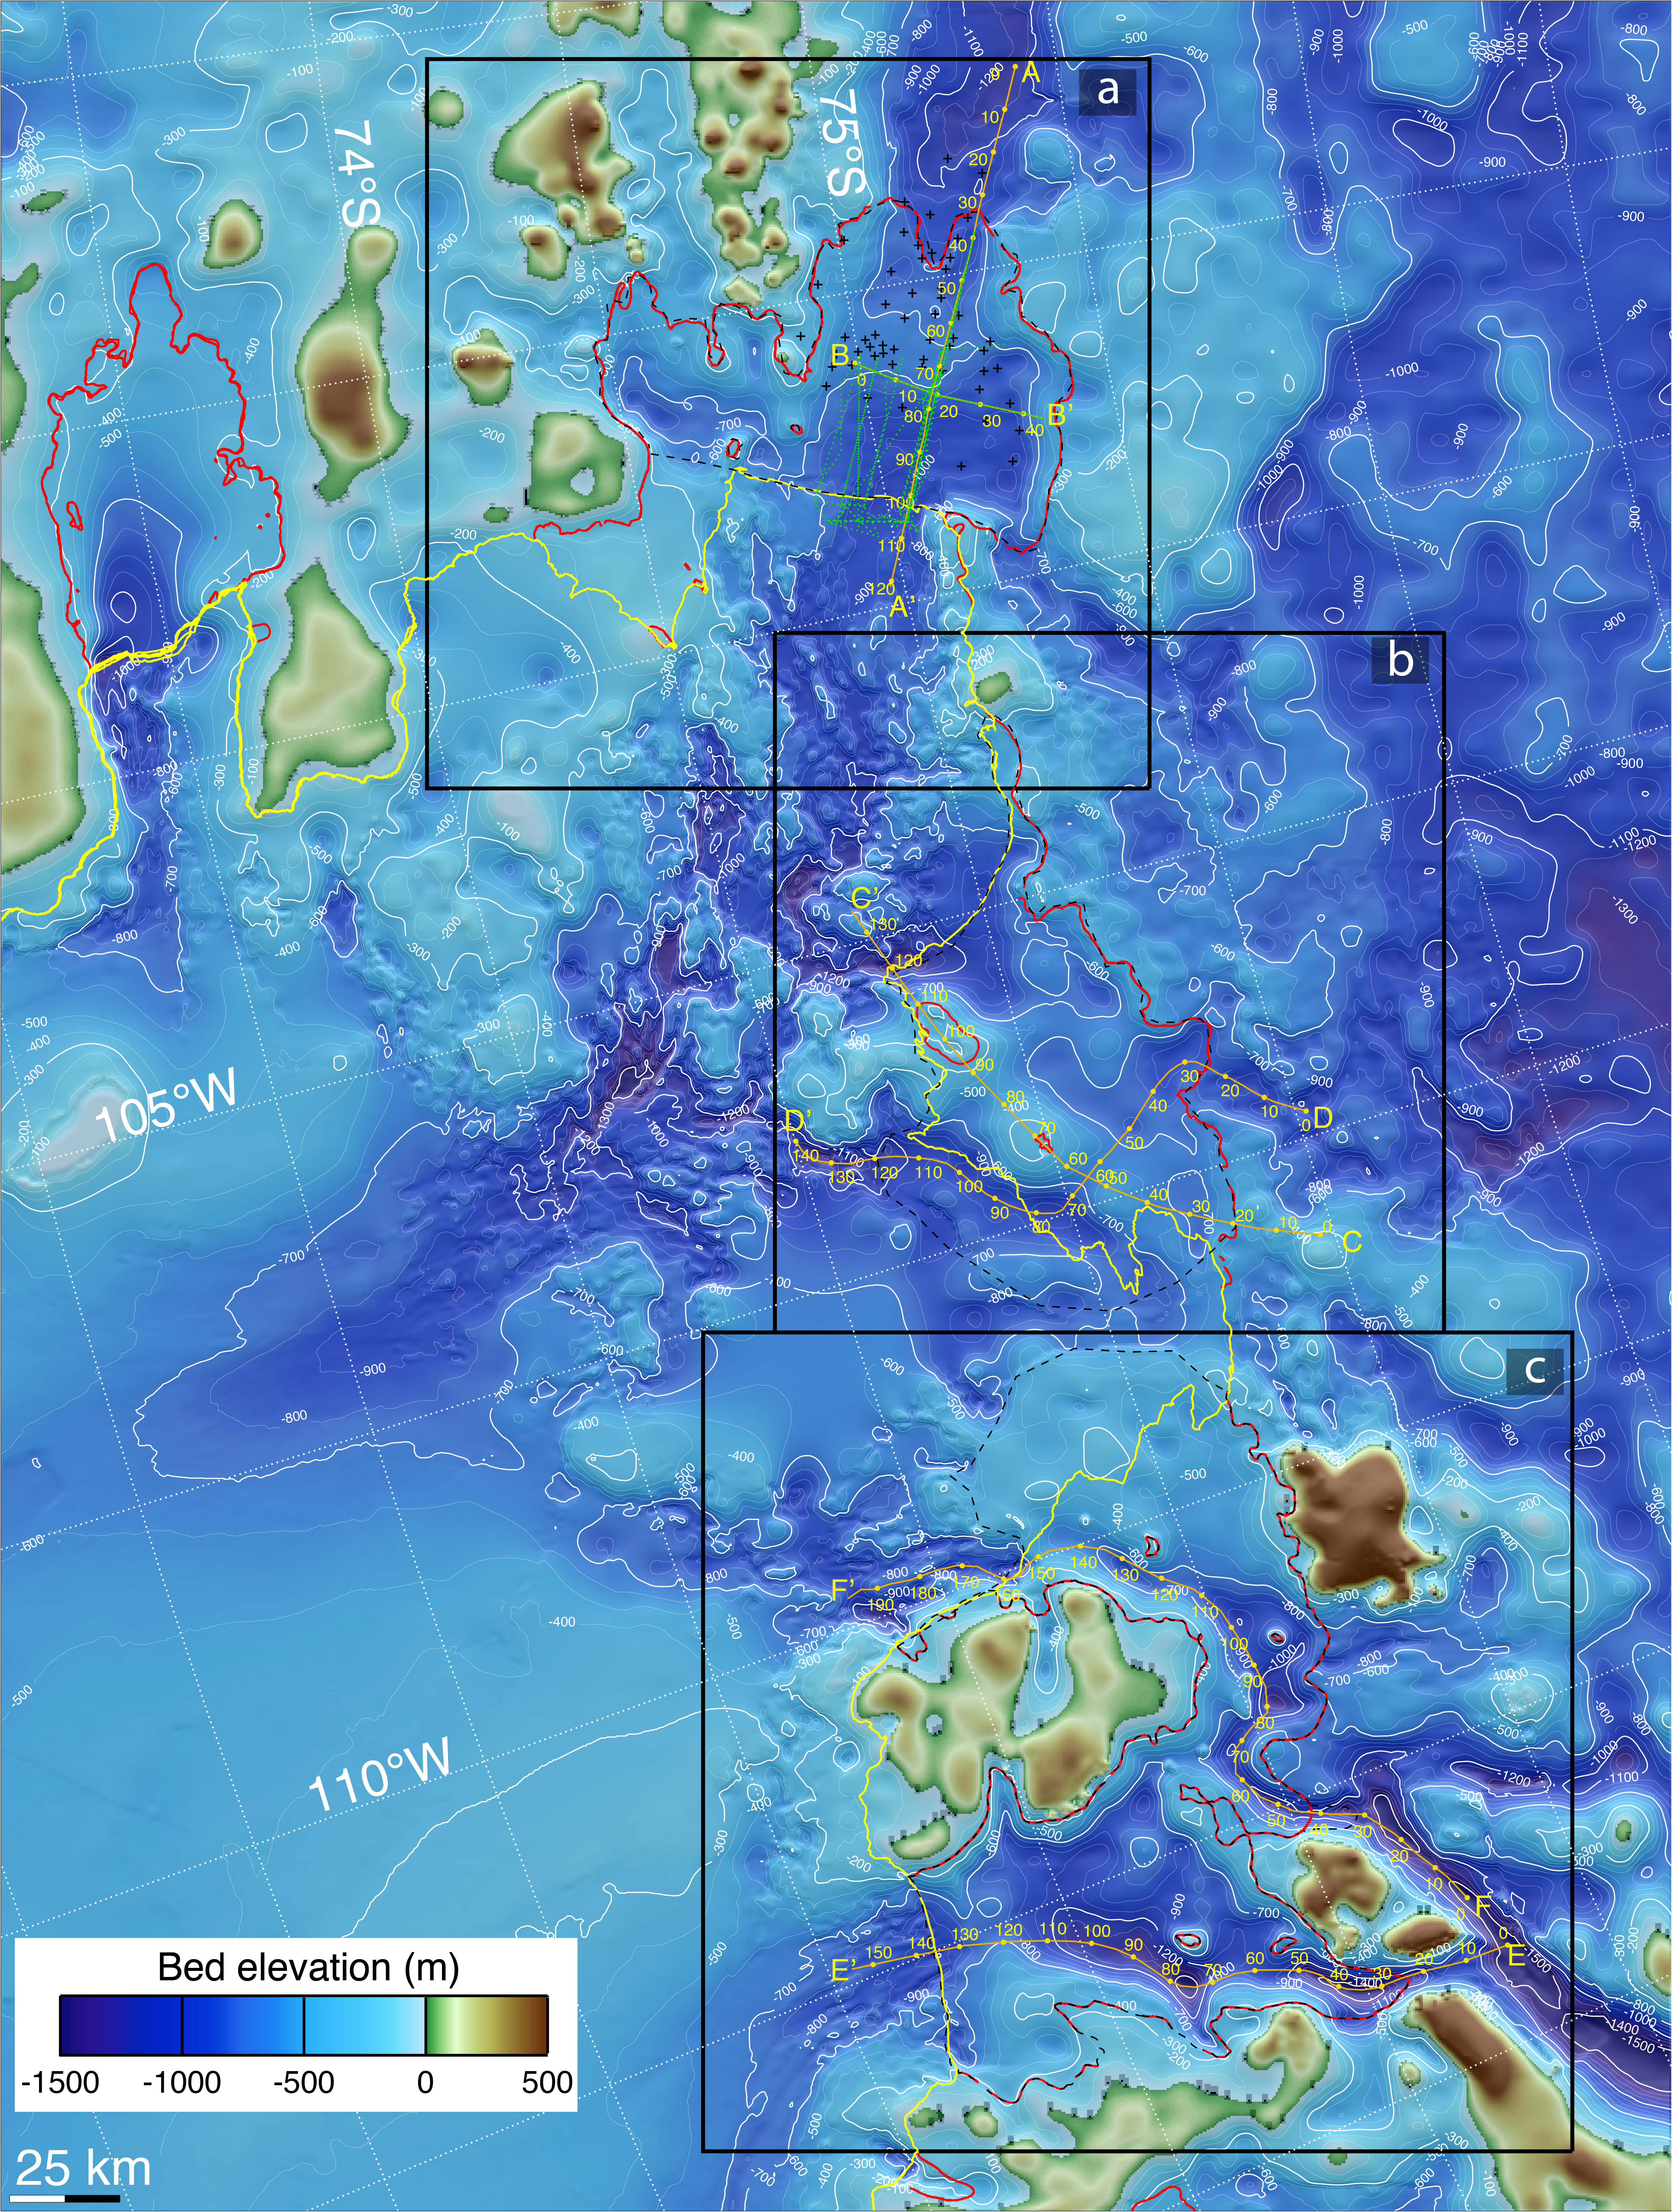
New bathymetry of the Amundsen Sea Embayment (ASE) of West Antarctica with the (a) Pine Island, (b) Thwaites/Haynes, and (c) Smith/Kohler glaciers. Grounding line positions are red (year 1996), ice front positions (year 2008) are yellow, AUV tracks are green, and seismic data are black crosses. Bed elevation is color coded from brown/yellow and green (above sea level) to light blue and dark blue (−1400 m), with light contours every 100 m and thick contours every 400 m [Millan et al., 2017].