I work on extreme events analysis at the University of California Irvine. Most of the time, I observe a huge difference of perception of extreme events from the people I talked to or from the news coverage. Hurricane and wildfire are for instance extreme and “spectacular” punctual events that gains a lot of attentions, while droughts, which are far more costliest, are gaining few to no attentions. I have decided therefore to use the NOAA Billions-Dollar Weather and Climate Disaster Database to show interactively how different extreme events are affecting each states in USA, to which extend, and at which cost.
I have used Tableau for online visualization, since it is interactive.
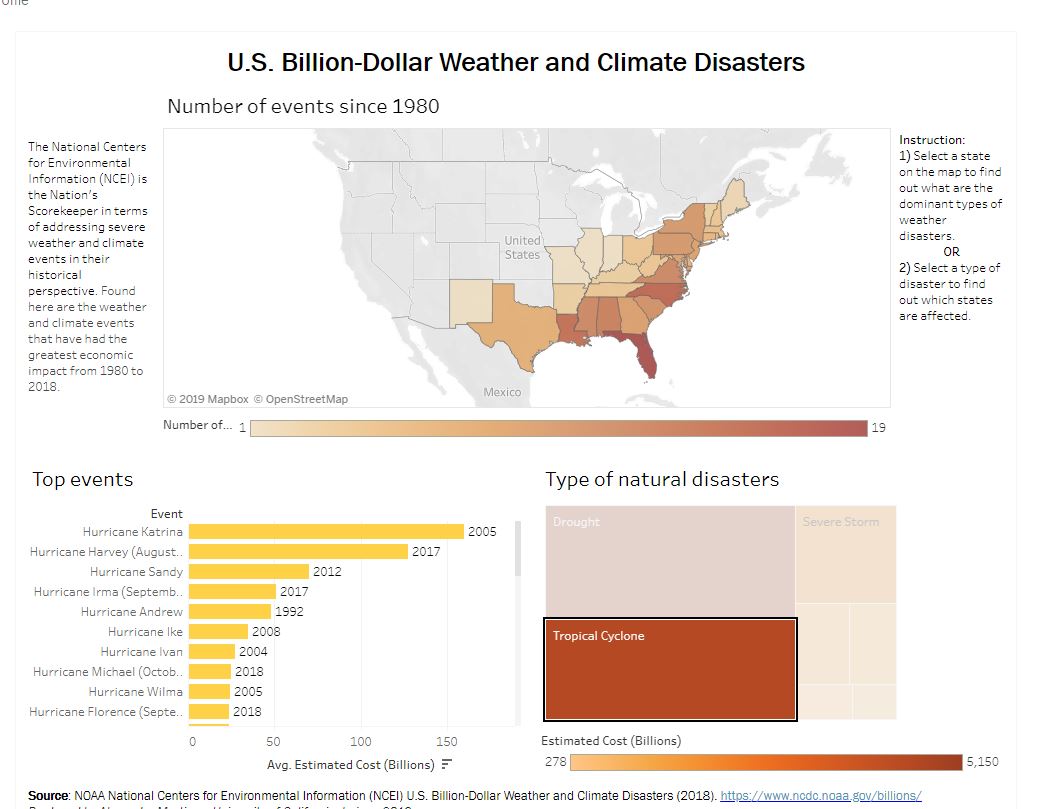
If you click on a state for instance, you can see the data for this specific state, as well as the top events.

Or if you click on a type of natural disaster (For instance tropical cyclone here), you can see all states which have recorded it and the top events as well.
You can explore the visualization and contacr me with any question. The Tableau workbook can be download with the Data embeded if you want to modify it.