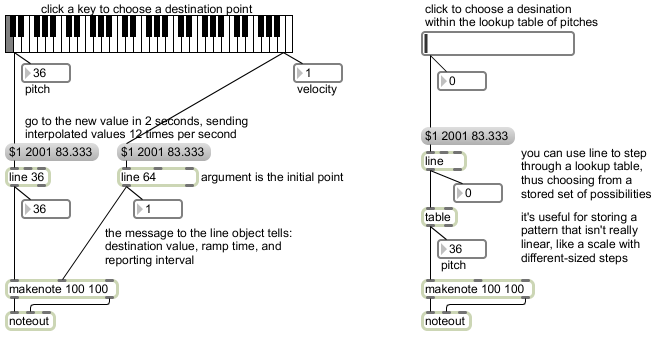
The line object interpolates linearly from its current value to some new destination value, ramping over a specified period of time, reporting its intermediate values along the way. In this example, we instruct line to ramp toward a given destination value, arriving there in 2 seconds, sending out a report of its progress (the intermediate values as it goes toward the destination) 12 times per second (i.e., once every 83.333 milliseconds). If you want line to do this sort of ramping behavior, you always need to give it a new destination time in its second inlet before you give it a destination value in its left inlet. Alternatively, you can give it all the information as a space-separated listof numbers, as is done here.
If you want to do a nonlinear mapping that you can’t easily describe with an arithmetic formula, it’s often best just to look up values in a stored array, also known as a “lookup table”. You can describe a nonlinear function over time by stepping through the values in a table. In the left inlet you specify the location that you want to access within the table (with location indices numbered starting at 0), and table sends out the value that’s stored at that location. In this example, we stored a synthetic musical scale in the table. (Double-click on the table object to see a graph of its contents.) To store that information as part of the patch, you have to check the “Save Data With Patcher” option in the table‘s Inspector. Then, to play only notes that belong to that scale from cello low C (MIDI 36) to flute high C (MIDI 96), we just need to read through table indices 0 to 35.

