
We have to thank Donald Trump for bringing up wind energy generation in his rallies again. Although, everything he said about them is false. He still calls them the old fashioned wind mills, but they are now called wind turbines, and are much more powerful than the old windmills. So much for him being the world expert on them. I think he brought them up as a quid pro quo for the coal companies which are backing his campaign, and will be replaced by cheaper wind power. 85% of US wind turbines are made in the United States. The Audubon Society recommends siting them away from birds, and many experiments are being carried out to prevent bird deaths.
Here is the Energy Information Agency (EIA) map of the states and the share of electricity generated by wind in each state:

We note that the central tower of states from Texas to North Dakota, including Oklahoma, Kansas, South Dakota and North Dakota, are dominant in share of electricity generated, including Iowa also, at 33.7%. Texas is included because it is the leading generator in amount. Kansas leads with 36.4%. These are all Republican states, which are leaders in clean wind power.
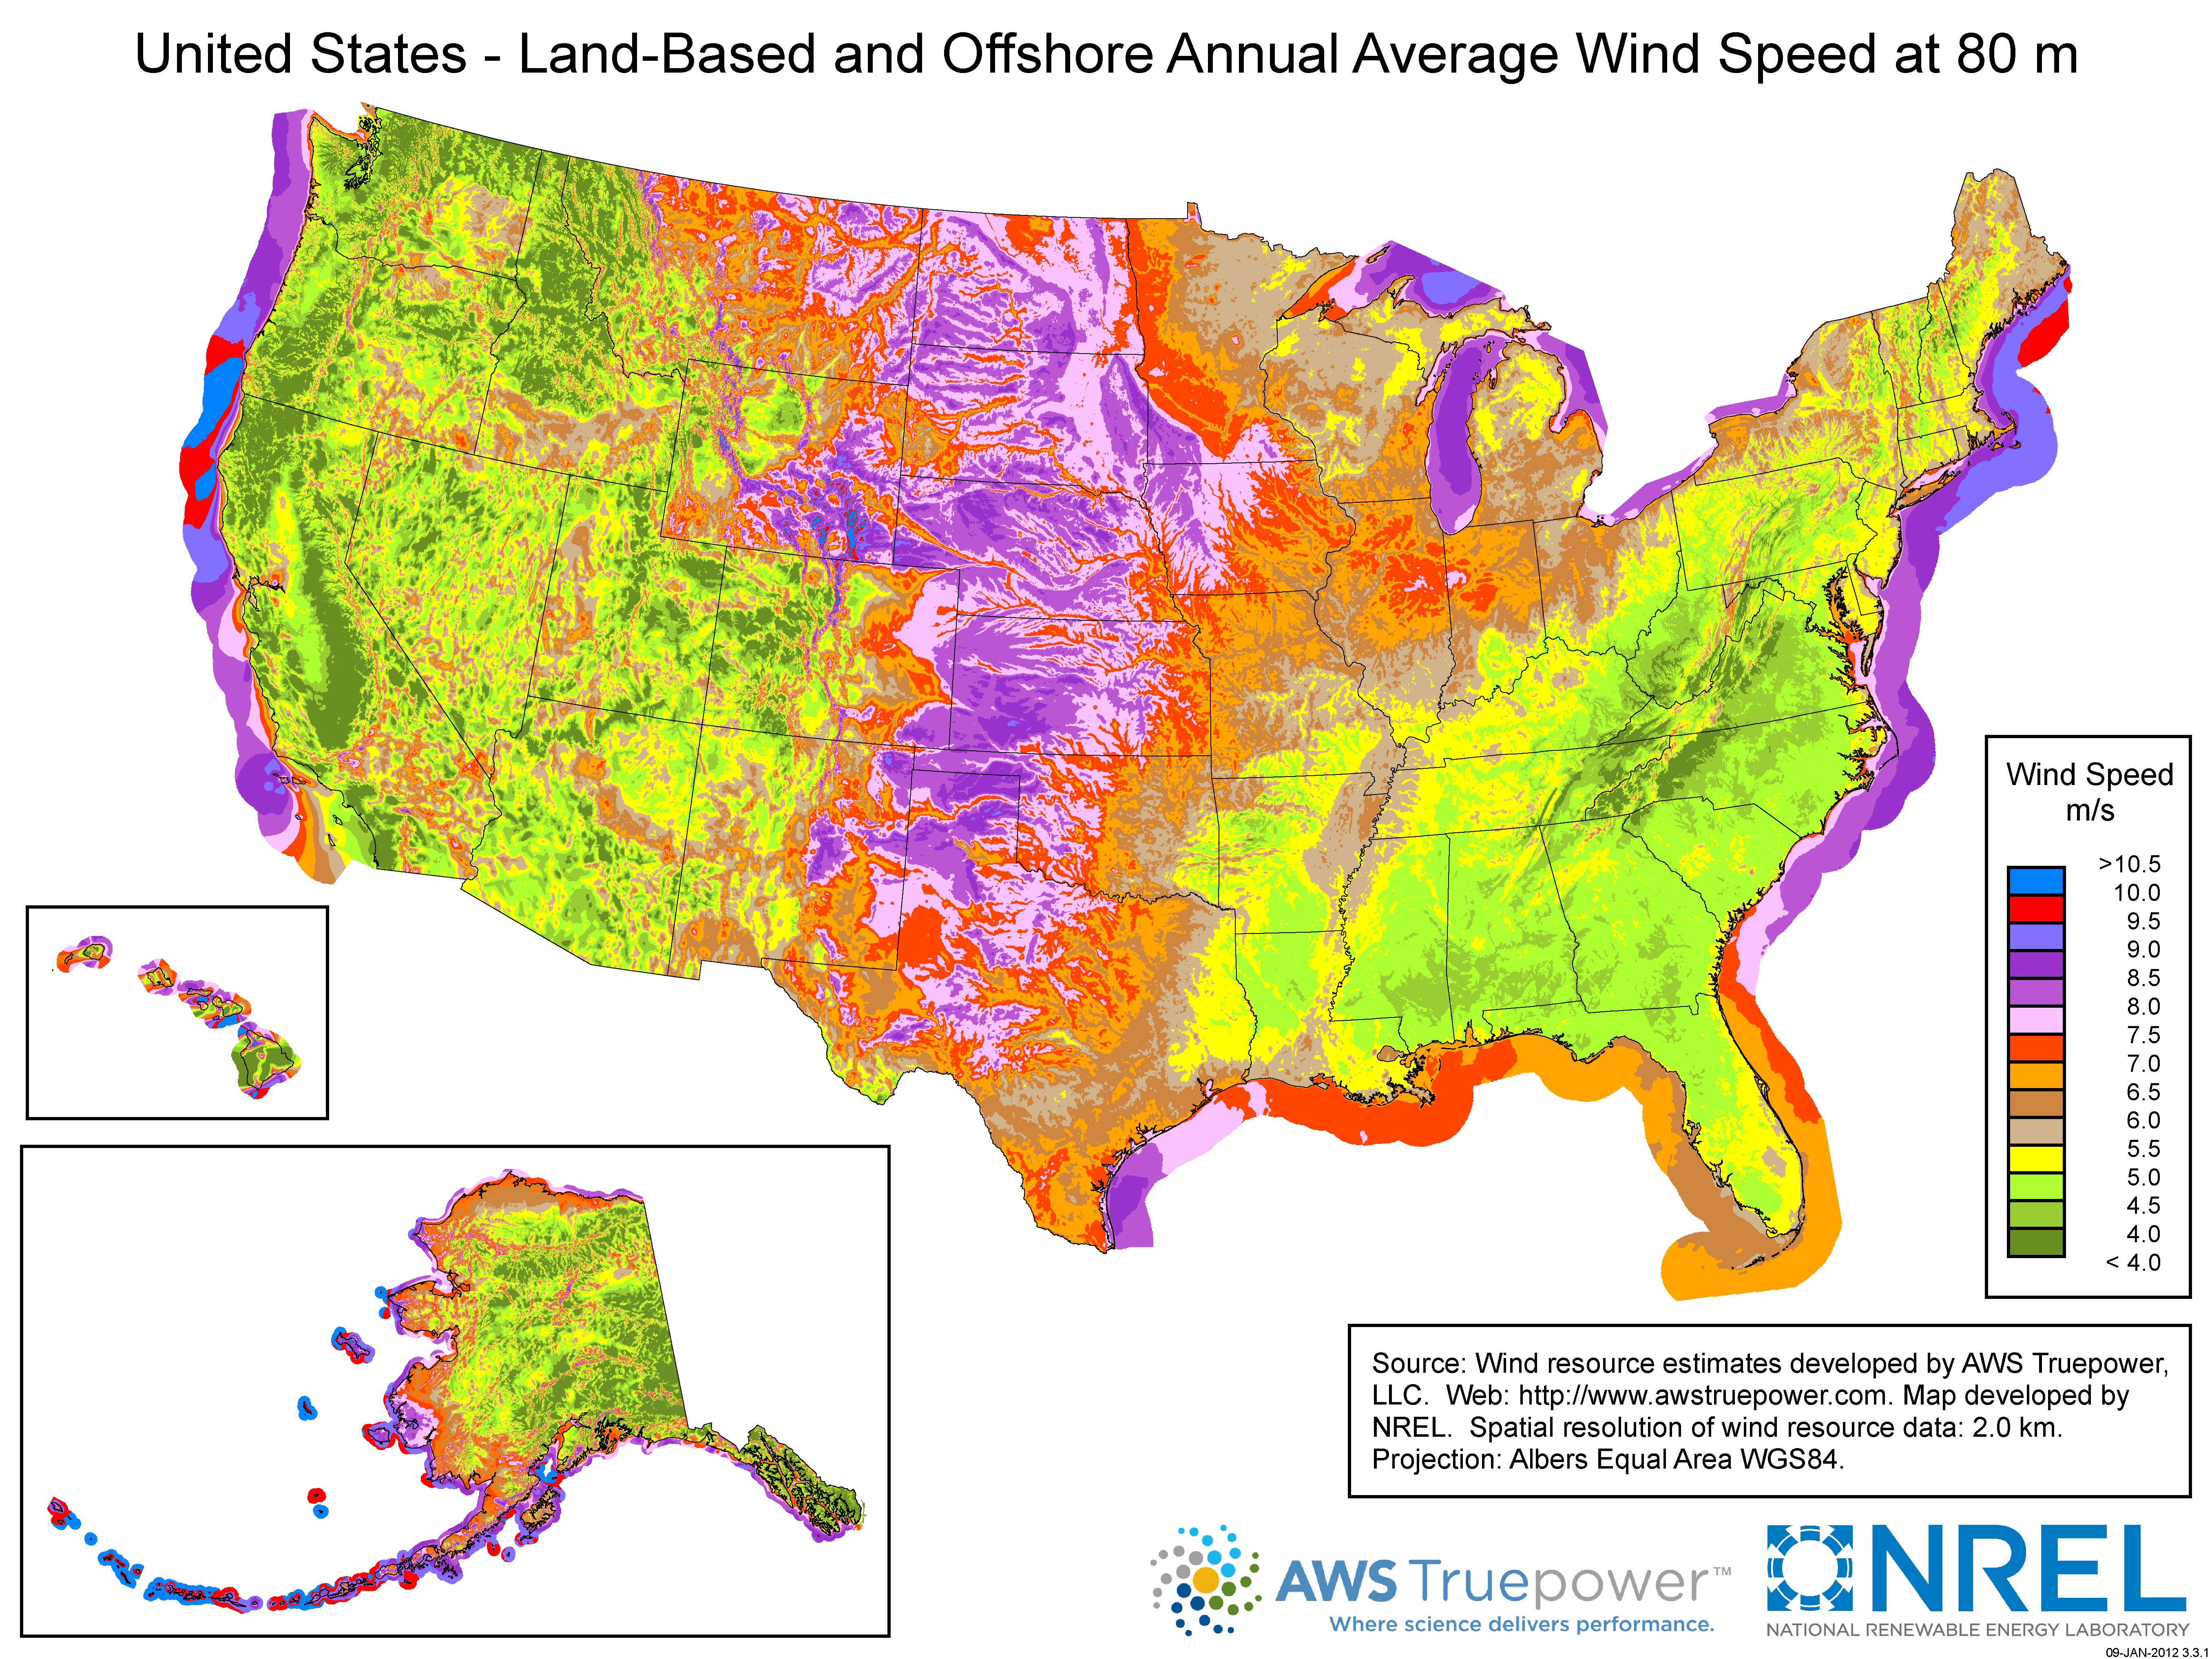
Here is the map of average wind velocities, showing the currents drawn upon by these states, and the potential of offshore wind power. I am reminded of the musical Oklahoma by Oscar Hammerstein, where “they call the wind Mariah”. The pressure on the blades is not only the momentum of the wind, proportional to the velocity, but also multiplied by how much is hitting the blades per second, again proportional to the velocity. So it goes proportional to mass times velocity squared, or energy in the wind.
For total installed capacity, Texas leads at the end of 2018 with 23,262 MegaWatts, and 5,554 under construction. This cost $42 billion, and powers 6.2 million homes. Oklahoma is second with 7,495 MW installed, and 1,966 under construction. This cost $13.7 billion, and powers 2.27 million homes. Iowa is a close third with 7,312 MW and 1,984 under construction. This cost $14.2 billion and powers 1.94 million homes. In fourth place is California, with 5,686 MW and only 55 under construction. This cost $12.6 billion, and supplies 1.3 million homes.
At the end of 2018, world wind power reached 597 GigaWatts, with 50 GW added in 2018. China leads with 217 GW, the US is second with 96 GW, followed by Germany with 59, India with 35, the U.K. With 20.7, France with 15.3, and Brazil with 14.5. In 2018, wind supplied 6.5% of US electricity.
For the US, we can compare this to our 97 Nuclear Reactors, with a capacity of 99 GW. However, the capacity factor, or fraction of wind energy delivered of the maximum installed capacity for wind is about 33%. Nuclear supplied 19.4% of US electrical power in 2018.
Also, in 2018, hydropower supplied 7% of US electricity, solar was 1.5%, and biomass was 1.4%. Total renewables was 16.9%.