
Costs of Weather and Climate Related Disasters Over the Last 40 Years, and During the Trump Presidency
The data and maps are from the NOAA National Centers for Environmental Information.
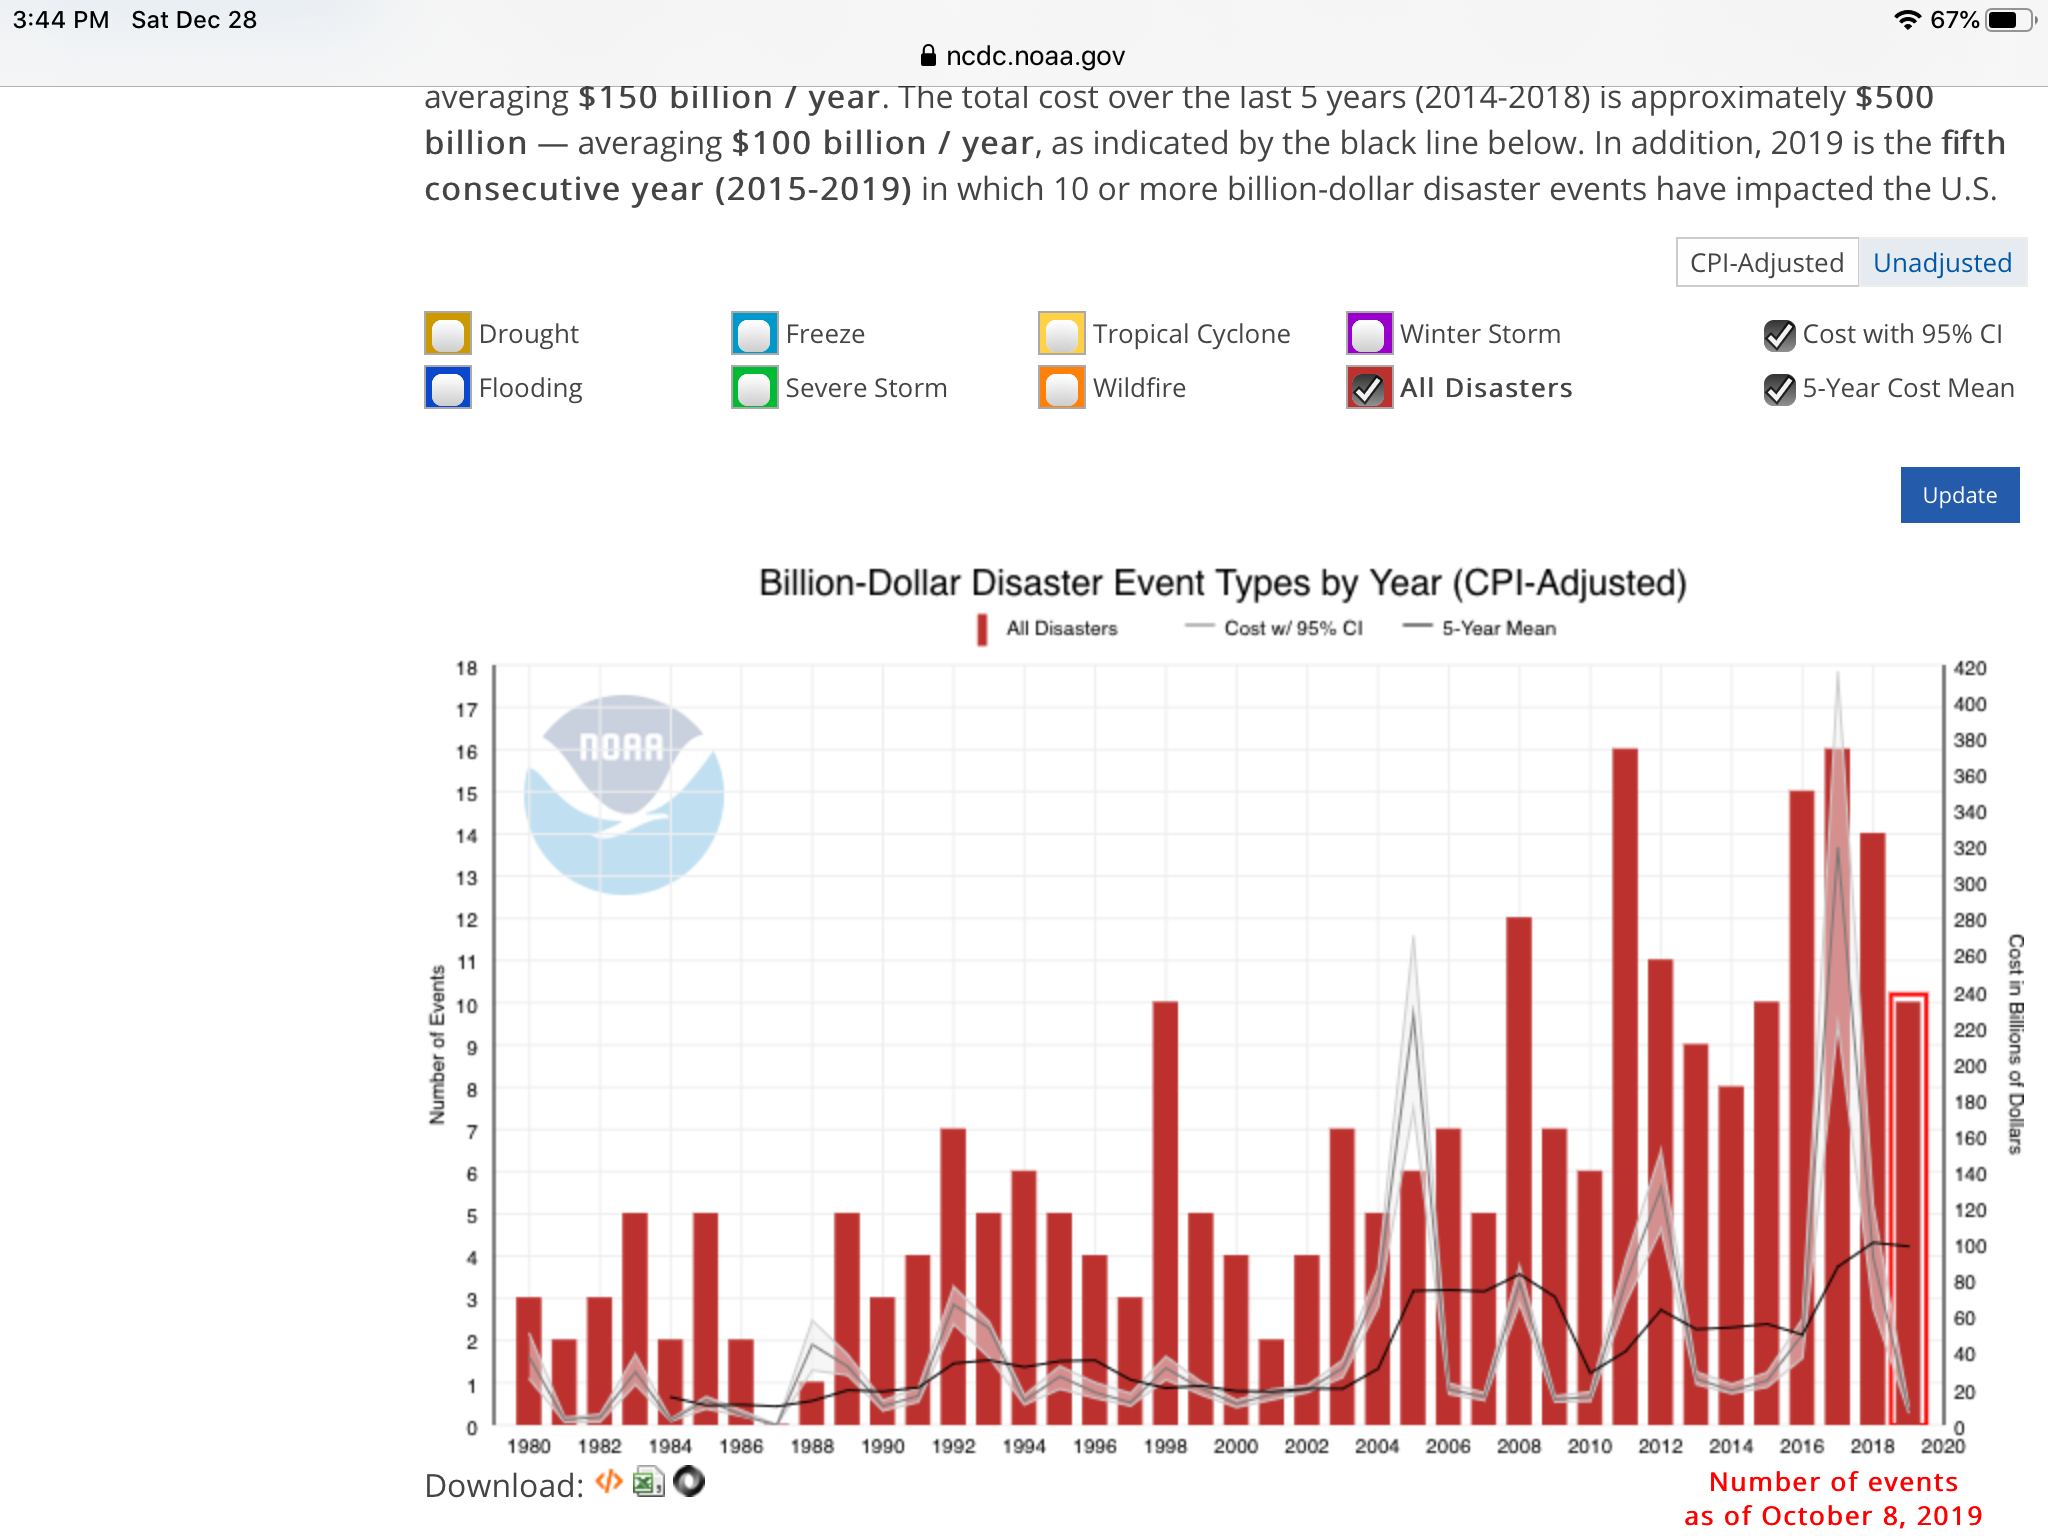
I’m jumping the storm a little since the data for 2019 is up to October 8, but won’t matter much in the 40 and three year totals. In the last 40 years, there have been 254 events of greater than a billion dollars in damage. Their total cost exceeded $1.7 trillion. The costs have been adjusted annually by the consumer price index (CPI).
The billion dollar events averaged 6.3 per year over the last 40 years, but have doubled to 12.6 average over the last 5 years. Here is the graph as the years developed, with 2008 and the last four years being the largest: 2017, 2016, 2018, and 2019. Look at the year’s total at December.

Starting with Trump’s election, during 2017 through October 8 of 2019, there have been 40 weather and climate disaster events of over a billion dollars. They included 2 droughts, 5 floods, 1 freeze, 21 severe storms, 7 hurricanes, 2 wildfires, and 2 winter storms. Tropical cyclones or hurricanes were 77.5% of the total cost, at $325.3 billion. Wildfires were 10.3% of the costs at $43.2 billion, and severe storms were 9% at $37.7 billion. The total losses were $419.7 billion, with 3,564 deaths.
During the Trump Presidency, 2017 through 2019*, the worst disasters were hurricanes and western wildfires, also shown with losses in human lives.
| Event | Damage | Lives Lost |
| Harvey | $130 billion | 89 |
| Maria (Puerto Rico) | $93.6 billion | 2,981 |
| Irma | $52 billion | 97 |
| Michael | $25.2 billion | 49 |
| Florence | $24.5 billion | 53 |
| West Wildfires 2018 | $24.5 billion | 106 |
| West Wildfires 2017 | $18.7 billion | 54 |
This US map shows states which had losses from the billion dollar events over the last 40 years.

The Great State of Texas is so large and populous at 29 million, that it suffered the most such events, at 91 plus.
Since President Trump denies human caused climate change, and has fought to remove any and all US and State programs of climate change mitigation, we show the map of the states that he won in 2016.

We see that most of the severely affected states in the South and Midwest voted for Trump.
Update: Huffington Post looked at the complete data, and broke it down by decade to show and increasing affect. We show the last four decades, and the number of billion dollar disasters that fell within each decade, below.
| Decade | Number of disasters |
| 1980-1990 | 28 |
| 1990-2000 | 52 |
| 2000-2010 | 59 |
| 2010-2020 | 115 |
The chart below shows the number of events per year in red using the left axis, and the moving five year average cost per year as the black line, read on the right axis.
The Huffington Post article “7 Numbers Show How Dire Climate Change Got This Decade” is an important summary, with many links.
I am reminded of the song by Pete Seeger: When will they ever learn, when will they ever learn.