Covid Updates: China, Long Covid, Bivalent Omicron Vaccine Success

Let’s start with the very positive.  The Pfizer bivalent Omicron vaccine is a success.  Israeli analysis of its use before patients 65 and over got infected, versus those not so boosted, showed that it resulted in 81% less hospitalization.  That is only 1/5 as many who took the bivalent booster were hospitalized as those who didn’t take it.

The deaths in China have reached 60,000, and that is close to the value predicted in the IHME model for that date.  However, one source stated that those deaths may be near peaking, whereas the IHME model predicts that by April 1, deaths may exceed 300,000, and go up to 500,000 if no masking requirements are reimposed.  A picture of travelers in China at a station showed everybody masked, however.

A Nature magazine briefing said that about 10% of those COVID infected would develop Long Covid, which are symptoms lasting more than 12 weeks after initial infection.  For the world, they said that this is 65 million worldwide.  The IHME model on January 18 show that we are at the peak of daily covid infection of about 21 million a day.  That would imply that 2 million a day would eventually develop Long Covid for a while.

Posted in Coronavirus, COVID-19, Health Care, Variants of Covid-19 | Leave a comment

IHME Global Covid Deaths Modeled at More Than Twice that which are Reported

IHME Global Covid Deaths Modeled at More Than Twice that which are Reported 

The bad news is that the IHME model of total Covid deaths, as of April 1, 2023 of 18.6 million, will be more than twice that which will have been reported.  The good news is that total Covid deaths in the first quarter of 2023 will be only 2/3 of a million, or a 3.7% increase over those which have already occurred by the start of 2023.  The other good news is that the quarterly deaths, without China, are roughly only a tenth of that from the previous year.

As of the projection for January 1, 2023, there were 17,910,000 total Global Covid deaths, and a projected 18,572,000 by the end of the first quarter of 2023 on April 1, or 662,000 more deaths, which is a 3.7% growth over January 1.  The modeled Reported Global Covid deaths by April 1 is 7,730,000, or only 43% of the total Global Covid deaths.  The projected first quarter deaths from China in the previous article are 281,351, which are 42.5% of the Global first quarter of 2023 total.  Without China, the new quarter deaths would be 381,000.

Current Global masking is only at 24%, and if that were to be increased soon to 80%, the total Global Covid deaths by April 1 would be reduced to 18,341,000, or only 231,000 deaths in the first quarter.  Out of the 662,000 deaths to occur with current masking, it is just 35% or a third of them.

Daily total Global Covid deaths on January 1, 2023 are modeled at 5,500 a day, which will increase to 8,900 a day by April 1, a 62% rise.  With 80% masking, 2,900 deaths a day could be saved on April 1, or 33%.

Global hospital use from Covid cases are modeled at 315,000 on January 1, with 49,000 of those in the ICUs, or 15.5%.  On April 1, these numbers are about the same, at 296,000 and 45,000, with ICUs at 15.2%.

Total Daily Global Covid infections will peak at around 21 million per day in late January, and drop to 17 million per day by April 1.  With 80% masking, infections will reduce to about 10 million per day in January, and rise to 17 million a day by April 1.  Reported new cases will be at only about a half million a day.

The Global infection fatality rate is less than 0.2% as of mid December modeling.  There are new variants in China and in the Northeastern US, but their fatality is not yet known.  The Global rates are partly driven by China, where 80% are susceptible to infection.  There is a low rate of receiving booster shots.  As of December 12, 2022, 77% of the Global population is modeled as infected at least once.  The infection detected rate is only 4%.  64% are fully (twice) vaccinated with the original vaccines, which will rise to 65% by April 1.  

The 77% infection rate of an 8 billion population would give 6,160 million infected.  With 17.9 million Covid deaths on January 1, that would give a 0.0029 historical global fatality rate or 0.29% or 3 out of a 1,000 including before vaccines and with deadlier strains than the Omicron ones.

The IHME model assumes that 80% of the fully vaccinated will get booster shots after 6 months of their original vaccination, and of the first boosted, 80% will get another boost after 6 months.  They also assume that in high income countries, 80% will receive antivirals when needed.

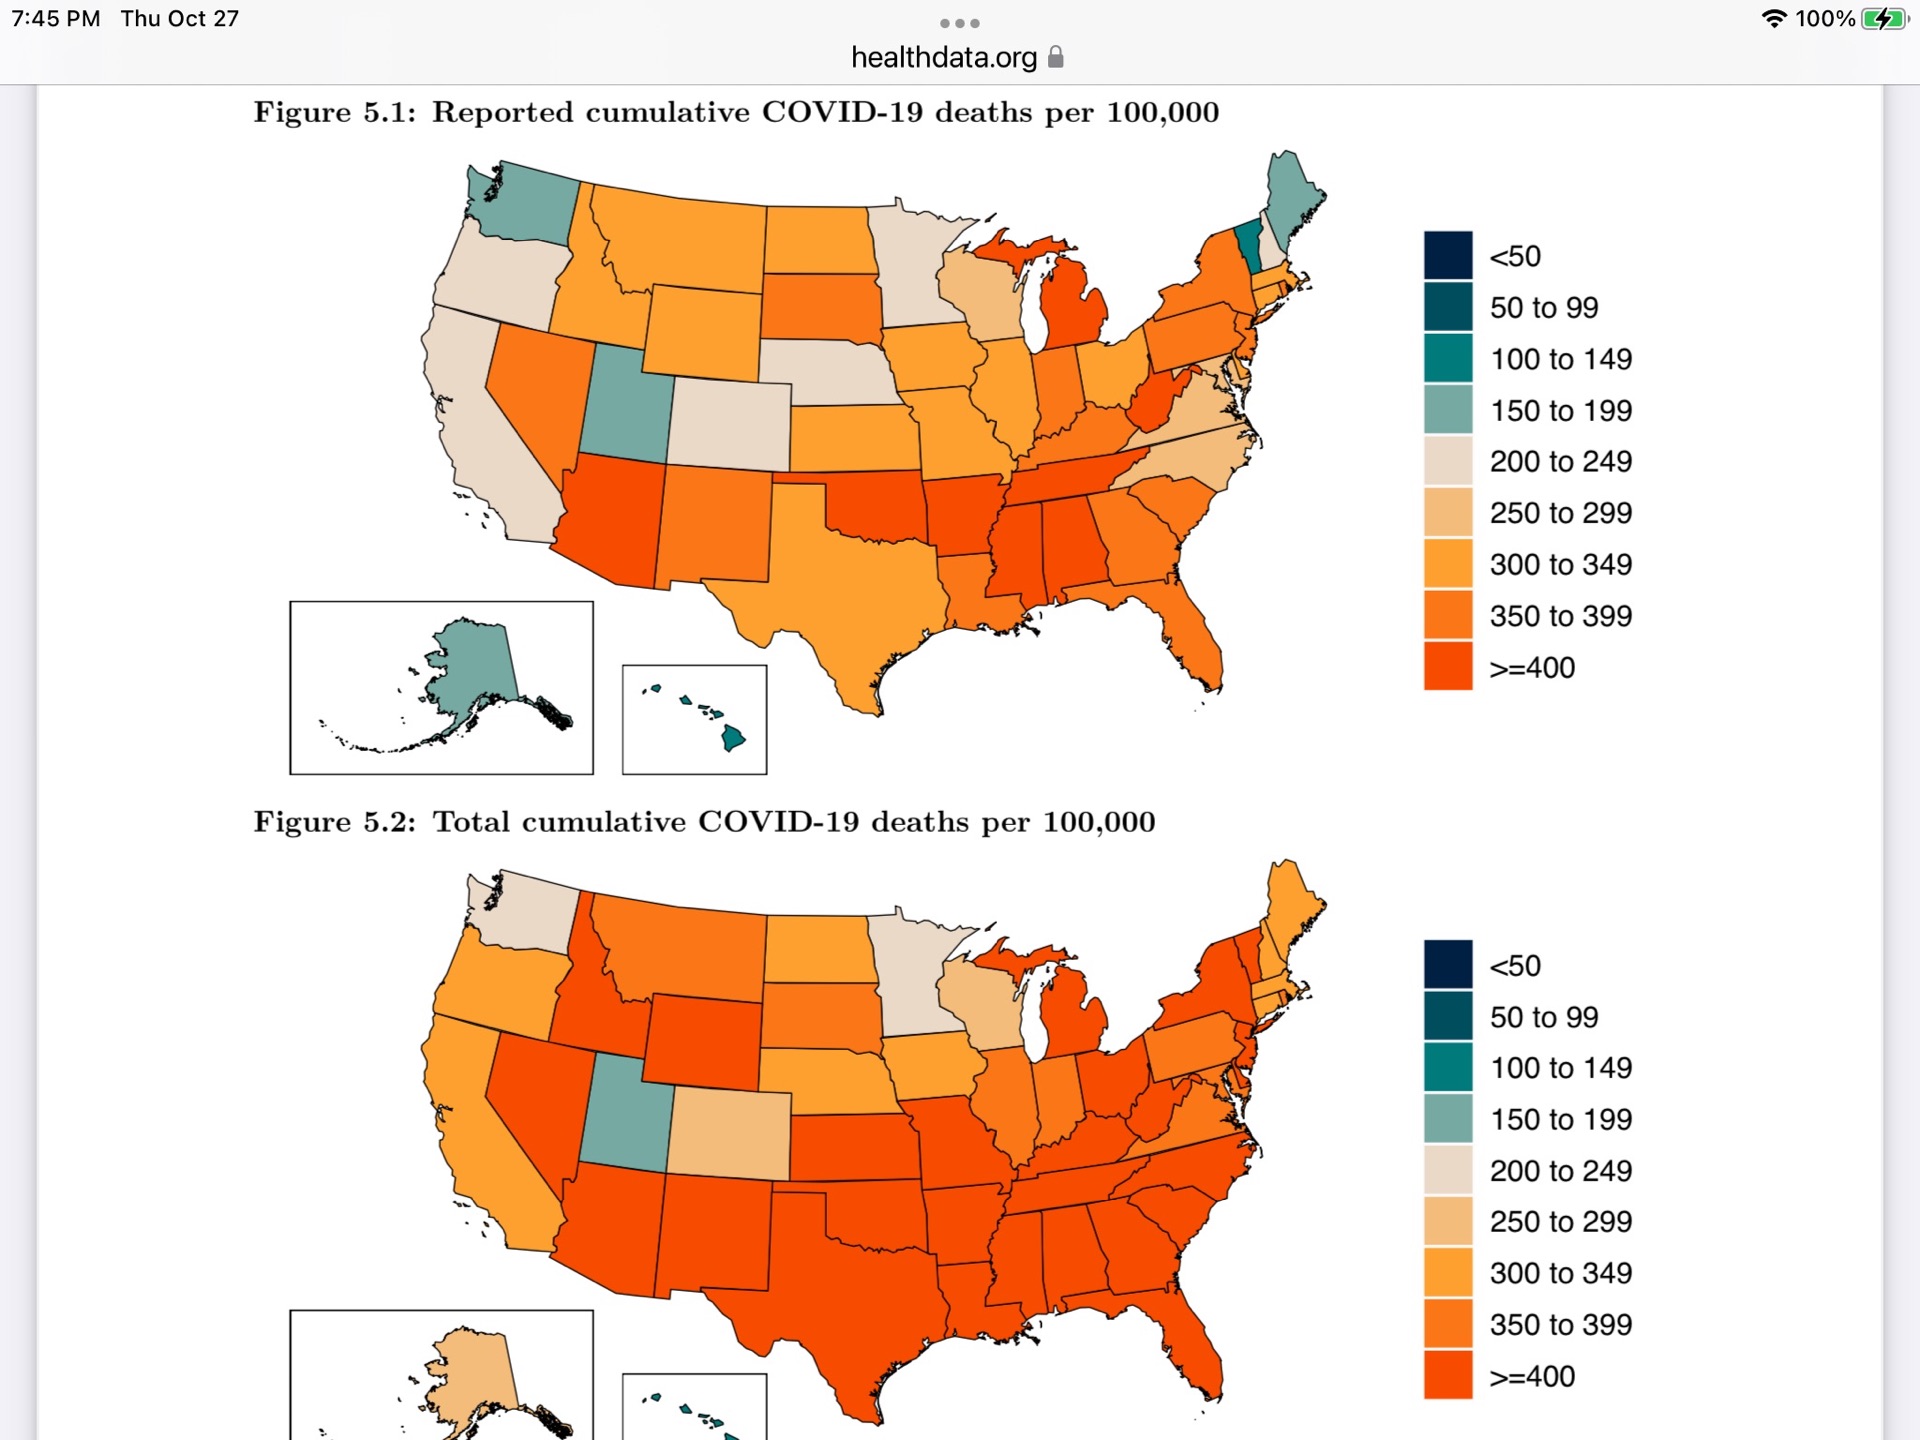
Global Reported and Cumulative Covid deaths per hundred thousand for Countries and states or provinces are shown in the two Global maps below.

We see that the Southern US states, middle South America, Southern African states, Eastern Europe, and Russia have suffered the highest fatality rates.

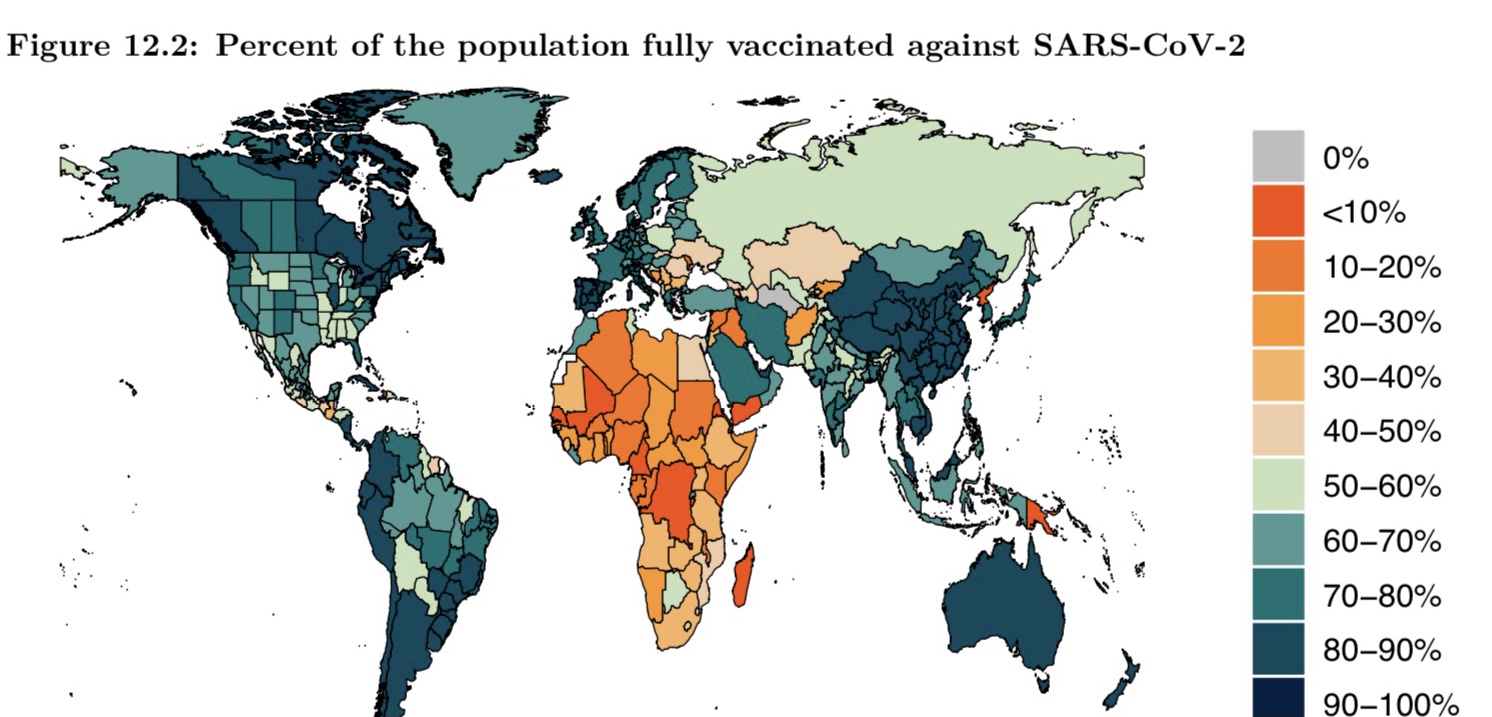
Percent population of Countries or States and Provinces which are fully (twice) vaccinated is shown below.

We see that African countries are poorly vaccinated, and Ukraine, Romania, the “stans” and Russia are only about half vaccinated.

The Global deaths peak on a quarterly basis, so we include a table of the IHME model total and quarterly deaths, starting in the first quarter of 2021 and ending on the projected first quarter of 2023.  Deaths are in millions.

Year Quarter Start Total Deaths Quarter Deaths
2021 January 1 5.138 2.272
7.410 3.925
11.335 2.719
14.054 1.377
2022 January 1 15.431 1.508
16.939 0.297
17.236 0.373
17.609 0.301
2023 January 1 17.910 0.662
18.572

Without China, the projected quarter of 0.662 would be 0.381, showing a fairly constant evolution of the rest of the world.  This shows that the rest of the world has essentially reduced its vulnerability and moved to less deadly viral strains roughly by a factor of 10 in the last year over the previous year.

Posted in Coronavirus, COVID-19, Health Care, IHME Projections, Russia, Vaccine Distributions, Variants of Covid-19 | Leave a comment

IHME Projections of Covid Surge for China with Peaking Infections in Mid-March

IHME Projections of Covid Surge for China With Peaking Infections Mid-March

The new December 16 issue of IHME Covid projections for China has fully vaccinated at 87%, with 59% masking.  Other sources say that China now has an inhaleable booster.  For those over age 60, 69% have received boosters, but fewer of those over 80.

The IHME Policy Briefing for China states that there is less than 10% Covid infections in much of China, but is 50%-60% in Inner Mongolia.  Only about 6% of Covid infections are detected.  BA.1/BA.2 is 50-74% of infections in most of China, but is lower at 25%-49% in Inner Mongolia.  BA.5 is 50-75% in Inner Mongolia, but 25%-49% in most of China.  There is projected to be a growth of immunity to BA.1/BA.2 to 28%, and BA.5 to 25%.  Currently 80% are susceptible because of the low effectiveness of vaccines and the long time since initial vaccinations.  In Beijing, the dominant strain is BF.7, short for BA.5.2.1.7, which is an offspring of BA.5 and more infectious with many asymptomatic cases, but also not overwhelming other countries where it is present.

In addition to the IHME Current Projection where masking mandates get reimposed by province when certain bounds are exceeded, the IHME also does a run not shown in the graphs, where the mask mandate is not reimposed.

Infections per day are projected to peak on March 14 at about 2.91 million a day with global antivirals, at 2.88 million a day with the Current Projection, and down to 2.13 million a day with an increase to 80% masking, saving 26% of the current projection infections.  With no masking mandate, daily infections are modeled at 4.6 million a day by March 1.  Today, infections are at 673,000 per day, which could be reduced to 615,000 a day or by 9% with 80% masking.

Hospitalizations will continue to rise though throughout the projections on April 1 where they will be at 96,744, with ICUs at 9,352 or 10%.  However, in the no masking mandate, hospitalizations will rise to about 150,000.

The IHME recommends China getting more effective vaccines from abroad, and also get Paxlovid.  China is already working on getting more seniors vaccinated.  They also need booster shots.  They are testing about a dozen vaccines.

Daily deaths in the model are still growing on April 1 where they are:

No masking mandate, 9,000 per day;

Current Projection,      5,362 per day;

Reported,                        5,058 per day;

With 80% masking,      3,881 per day saving 28% over current projection; or

With global antivirals,  4,361 per day saving 19% over current Projection.


Total Deaths by April 1 are modeled at:

No masking mandate, 500,000;

Current Projection,      322,660;

Reported,                        293,127 or 91%;

With antivirals,              275,308 or 85% saving 15% of the current projection; or

With 80% masking,      249,971 or 77% saving 23% of the current projection.

In the Current Projection, the peak is around April 1, but will continue for many months.  There could be more than 1 million deaths during 2023. 

Posted in Coronavirus, COVID-19, Health Care, IHME Projections, Omicron Variant, Vaccine Distributions, Variants of Covid-19 | Leave a comment

Being Vaccinated and Boosted Reduces Covid Deaths of Seniors by a Factor of 10

In mid-2022, being vaccinated and boosted reduced the mortality of those 65 and over to only 10% of the unvaccinated in that age group.

Since April 2022 to September 2022, for the senior 65 and over population, Covid deaths have been 40% unvaccinated, 22% primary vaccinations only, and 39% vaccinated and boosted.  We apportion this to the vaccination status of those seniors, which is 7% unvaccinated, 26% only primary vaccinations, and 67% vaccinated and boosted.

The ratios of the percentages are then:

unvaccinated, 40%/7% = 5.7;

primary vaccinations only, 22%/26% = 0.85; and

vaccinated and boosted, 39%/67% = 0.58.

So the primary vaccinations reduced the morbidity to 0.85/5.7 = 0.15 or 15% of the unvaccinated.

The vaccination and boosted reduced the morbidity for seniors to 0.58/5.7 = 0.10 or 10% of the unvaccinated, or by a factor of 10.

As an newer addition, with the new bivalent booster, the CDC has stated that for people ages 12 and over, it has reduced the risk of death by a factor of 15 over an unvaccinated person.

Posted in Coronavirus, COVID-19, Omicron Variant, Vaccine Distributions, Variants of Covid-19 | Leave a comment

Covid Mortality Currently Increasing a Factor of 3 for Each Decade Among the Elderly

The Washington Post has data for the increase in percent of covid deaths by decade among those 65 years and over.  This is for the month of October for the current viral mix.  We divide this by the population in each of the same age segments, to show that the Fatality Rate is increasing a factor of about 3.3 for each decadal increase in age among seniors.

Unfortunately, the data does not include whether those succumbing were fully vaccinated and boosted, although the overall rate of vaccination among seniors is high, as shown in the previous blog article.

As the CDC is reminding people, we now have the bivalent Covid vaccine, high quality masks, crowd avoidance, increased ventilation if indoors, and rapid home tests as protective measures at our disposal at low or no costs.   There are also antiviral medicines to take after infection.

The following table has the three senior age groups, the size of the population in them for the US in millions, and the Percent of the US Population that they are.  That is followed by the Percent of Deaths in that age group in October, 2022.  Finally is the Ratio of Percents representing the Covid Mortality as currently occurring by senior age groups.

Age Group Population Percent Pop. Percent of Deaths Ratio of Percents
85+ 6.6 m 2.0% 41.4% 20.7
75 to 84 16 m 4.8% 30% 6.3
65 to 74 31.5 m 9.5% 17.5% 1.84
1 to 64 278 m 83.7% 11.1% 0.13

The ratio between the Ratio of Percents for 85+ to (75 to 84) is 3.33.

The ratio between the Ratio of Percents for (75 to 84) to (65 to 74) is 3.42.

So over 65, each decade of increased age, and of course with them more health complications, increases the mortality from Covid by a factor of about 3.3 or 3.4.

The importance of this message if for seniors to get the latest booster and obey all of the precautions that you can, as well as choosing to isolate and FaceTime or Zoom, or only mix with those willing to take the avoidance precautions that your age and susceptibility deserves.

Posted in Coronavirus, COVID-19, Vaccine Distributions | Leave a comment

Full Vaccinations for the US and the Four Largest States, Including by Ages

The data are from The NY Times for the US, the largest states of CA, TX, FL, and NY.  We also include the local counties of Los Angeles, Orange, and San Diego in California.

Nationally, 68% are fully vaccinated, meaning the first two original shots, and 34% of all ages are boosted.  For those most vulnerable, 65 and over, 93% are fully vaccinated, and 67% have at least one booster shot.  For the latest bivalent booster, as of November 18, only 35 million or 11% have gotten that.  They are now available for ages 5 and up for Pfizer and ages 6 and up for Moderna.

This table is the full and booster vaccinations for CA, TX, FL, and NY, and the age breakdown for full vaccinations for those states.

Age CA TX FL NY
Full All Ages 74% 62% 69% 79%
Booster All 42% 23% 29% 38%
5 to 11 39% 28% 22% 40%
12 to 17 75% 60% 57% 75%
18 to 64 82% 70% 74% 88%
65+ 93% 88% 93% 95%

We see that seniors, who are most at risk, have achieved high levels of full vaccination.  The Republican states of Texas and Florida lag the Democratic states of California and New York.  Together, these four states contain a third of the US population.

This table has the full and booster vaccinations for all and for 65+ of the three counties surrounding UC Irvine:  Orange County, Los Angeles County, and San Diego County.

Age Orange Los Angeles San Diego
All Full 74% 74% 79%
65+ Full 93% 88% 95%
All Booster 43% 42% 41%
65+ Booster 75% 72% 74%

Again, ages 65+ have achieved high full vaccination rates, and fairly good full vaccinations for all.  Booster rates are fairly good for 65+, but only around 40% of the entire population.  The three counties are quite similar.

Posted in Coronavirus, COVID-19, Vaccine Distributions, Variants of Covid-19 | Leave a comment

IHME Covid Projections to March 1, 2023, for the United States

IHME Covid Projections to March 1, 2023 for the US

This article includes the IHME model projections, now until March 1, 2023.  As usual, I am not a doctor or an epidemiologist so this is not to be considered authoritative, nor do I represent UC Irvine in this.

The November 17 IHME model projections are that Covid total deaths in the US are 1.3 times the reported deaths.  The infection detection is only at 5%.  97% of Americans have been infected at least once.  BA.5 is the most common variant in the model.  Recent data show that BQ.1 and BQ1.1 are now about half, and BA.5 is about a quarter of infections.  Masking is down to only 8%.  70% are fully (doubly) vaccinated, which will rise to 74% by March 1.  Immunity to BA5 from infection or vaccination is at 65%.

On March 1, in IHME, daily infections are projected at 1.3 million per day, which could be reduced to 60% of that or 0.77 million per day with 80% masking.  Daily hospital occupancy by Covid patients would peak at 35,000 around mid February, and could be a minimum with 80% masking of about 9,500 in mid January.

In the IHME model, hospitalizations will peak about 34,700 around mid February, which could be reduced to a peak around 9,500 in mid January with 80% masking.  Daily infections on March 1 are around 1.3 million a day, which could be reduced to about 0.8 million a day then with 80% masking. 

We are most concerned with the vaccinations of the elderly, and the distribution and effectiveness of the new bivalent vaccine for the original Covid and the BA.5 variant.  This is most important during the winter and holiday season, especially today, one day after Thanksgiving, and on store crowding Black Friday.

From The NY Times, hospitalization for Covid is at 22,200.  A year ago it was double that at 45,000, and two years ago is was 3.5 times that at 78,000.

Only 35 million Americans or 12% of adults or 11% of age 5 or older have received the new bivalent booster.  The government has purchased 170 million doses, or enough for half of all Americans.

Posted in BA.5 Variant, Coronavirus, COVID-19, IHME Projections, Vaccine Distributions, Variants of Covid-19 | Leave a comment

IHME Global Covid Projections to February, 2023

The Global Death Rate from Covid will remain relatively low through the next three months, only increasing from about 1,660 to about 2,750 per day, or 65%.  The modeled Total Death rate is about 1.7 times the Global Reported Death Rate.  Covid deaths have fallen to 1/17th of the rate of the sum of heart and stroke deaths.  Covid is now the 17th highest cause of death globally.  Global daily deaths are down to 0.025 per 100,000 per day.

As of October 17th, 75% of the world’s 7.9 billion population has been infected by Covid.  Outside of China, that is about 90 percent.  Infection detection globally is only about 3%.

BA.5 is the dominant variant and is of the Omicron variety.  The infection fatality rate is less than 0.2%.

24% of the world is masking.  About 69% have received one vaccine shot, and 64% are fully vaccinated with two shots.  Those unvaccinated and unboosted are at risk of long Covid.

The IHME model has 17.678 million Global Covid Total Deaths as of October 29.  The Reported Deaths are only 7.143 million deaths, which is only 40% of the modeled Total Deaths.  The Total Deaths three months from now on February 1 are projected at 18.031 million, or an increase of 353,000, or 2.0% more Total Deaths.

Global Hospitalizations on October 29 are given as 245,000, with 14% of those in ICUs.  On February 1 these are projected to increase 4.5% to 258,000 with 13.4% in ICUs.

Estimated Daily Global Infections on February 1 are predicted to be 18.6 million a day, up 12% from 16.6 million a day on October 29.

The following map shows that vaccinations are generally low in Africa, as shown by red-yellow colors, and medium in Russia and Ukraine.


The following map shows per 100k capita Covid Reported and Total or Cumulative Deaths.      The red, orange, and beige colors are largest, covering Russia, South America, some of Africa, and Southern US states.


Posted in Africa, BA.5 Variant, China, Coronavirus, COVID-19, IHME Projections, Russia, Ukraine, Vaccine Distributions, Variants of Covid-19 | Leave a comment

IHME Covid Projections for China to February, 2023

The very low number of Covid deaths in China look like it will peak and then somewhat decline.  However, by February, the total deaths are only projected to be 8.4 per 100,000, compared to 417 per 100k in the US, a factor of 50 lower.  The IHME projections are always much smaller than occur for China, since China sticks to the Zero Covid lockdowns and testing.  The latest 5 year Congress has only strengthened Xi Jinping’s command for another five years, and determination to stick with that policy.  The projections for 80% masking from the current 59% will only save 7.4% of the future lives lost.

87% of Chinese will have been fully vaccinated by February 1.  Mask use is 59% countrywide.  The Chinese vaccine CanSino is 48% effective against severe disease, and 32% against infection.  The vaccine Sinopharm is 53% effective against severe disease and 35% against infection.

The Total Deaths by February 1 are 117,840, and with 22,192 modeled on October 26, leaves 95,648 to occur by February 1.  With a population of 1.4 billion, this is only 8.42 per 100k, compared to the projection for 417 Total Deaths per 100k in the United States, or one fiftieth of it.  With 80% masking, there are projected to be 110,717 deaths by February 1, saving 7,123, or only 7.4% of those to occur.

Total Daily Deaths on October 26 are modeled at only 167, or 0.01 per 100k.  By February 1 they will be 1,294 a day, or 0.09 per 100k.  With 80% masking there will be 1,184 a day or 0.08 per 100k.  With antiviral medicines, this will be 1,040 a day, or 0.07 per 100k.  Currently, death by Covid is only the 77th ranked cause of death in China.

Hospitalizations on February 1 are projected at 68,329, including 6,749 or 9.9% in the ICU.  On October 26, they are modeled at 17,258, with 1,710 in ICUs or 9.9%.

Infections per day now are modeled at 1.10 million per day,   They will peak on November 17 at 2.79 million a day.  With 80% masking this will only be reduced by 6.3%.

Only 8% of Chinese have been infected as of October 17.  The infection detection rate is only 2%.  Immunity against the Delta variant is estimated at 35% now, to grow to 42% by February 1.  BA.1/BA.2 is active in 31 locations, and immunity to it is 19% to rise to 26%.  BA.5 is active in 33 locations, and immunity to it is 17% now, to rise to 23%.

Posted in Uncategorized | Leave a comment

IHME Covid Projections for the US to February, 2023

Pretty much steady as she goes.  The latest run was using data up to October 18.

Total deaths on February 1 are 1,389,053.  Subtracting the model total for October 27 of 1,353,396 gives 35,653 more deaths to go.  Again, I keep the exact model numbers just for subtractions and ratios.  With 80% masking, the total deaths to go would be reduced by 7,272, saving 20%.

Current masking is only at 8%.  Full initial two vaccinations by February 1 are 74%.  Most of the new infections are of the BA.5 variant at 75%-89% for all states. Infections of BA.1/BA.2 is 10%-24% for all states.  Immunity through infection or vaccination from BA.1/BA.2 variants is 62%, and from BA.5 is 57%.  There are graphs for these by states later on.  The effectiveness of the Pfizer vaccine against severe disease by Omicron is modeled at 72%, and against infection is 44%.  The effectiveness of the Moderna vaccine against severe disease is 73%, and against infection is 48%, quite similar to the Pfizer effectiveness.

Total Deaths per day in the model on October 27 are 382, of which 303 are reported.  Total Deaths will slightly dip, and then increase to 435 per day on February 1, while reported deaths will be at 335 per day.  With 80% masking, Total Deaths per day would be 319 per day on February 1, or 73%.

Hospitalizations on October 27 are modeled at 24,152, including 2,783 in ICUs, or 11.5%.  On February 1, these would be about the same at 25,790, with 3,028 in ICUs, or 11.7%.

Estimated Daily Infections on October 27 are modeled at 762,557 per day, which will increase to 1,011,810 per day on February 1.  With 80% masking, this could be reduced to 80% of those, or 812,360 per day.  The infection fatality rate is less than 0.2%.

Here is their map by states of Reported and modeled Total Deaths per 100,000 population.  The projection for February 1 is that US Total Deaths will be 417 per 100k.  It is currently at 408 per 100k.

Southern states are mostly >= 400 per 100k.  California and others are 300-349 Total Deaths per 100k, while Reported deaths are 200-249 per 100k. Washington and Wisconsin are exceptionally good at 200-229 Total Deaths per 100k.

Below are the maps by states of those who received one or two of the first vaccines.  Now, we have a one shot bivalent booster vaccine which covers the original Covid and the omnipresent BA.5 Omicron variant.  Only about 6% of the US population has gotten it so far.

Again, some southern states are content with 50%-60% fully vaccinated.


Posted in BA.5 Variant, Coronavirus, COVID-19, Health Care, IHME Projections, Omicron Variant, Vaccine Distributions, Variants of Covid-19 | Leave a comment