Select Countries in the Global Women Index of Inclusion, Justice, and Security for 2021/22

We examine the ratings of large countries and countries of concern in the Women Peace and Security Index of 2021/22.  The survey by the Georgetown Institute for Women, Peace, and Security (GWIPS) includes 170 countries, in three categories of Inclusion, Justice, and Security.  The subtopics of each category is shown below.

In general, they conclude that the advance has slowed and disparities have widened among countries.  There are 90 million displaced women worldwide.

The United States ranks 21st, with a combined score from 0 to 1 of 0.861.

Under Inclusion, the mean years of schooling in the US is 13.5.  Employment percent is 52%.  Cellphone use is 94%.  Financial inclusion is 92.7%.  But women’s share of Congressional seats is only 26.8%.

Under US Justice, discriminatory norms is 1, son bias M/F birth ratio is 1.05, and absence of legal discrimination against women is 91.3.

Under US Security, women’s perception of community safety is 70.6%, and current intimate partners violence is 6%.

Among main European and North and South America countries we have the combined rank and rating on a scale of 0-1 the table.

Rank Country Index Score
9 UK .888
11 Germany .880
12 Canada .879
14 Spain .872
15 France .870
21 US .861
28 Italy .842
29 Poland .840
46 Hungary .790
49 Ecuador .774
71 Venezuela .746
80 Brazil .734
88 Mexico .725

Among Asian countries we choose to show:

Rank Country Index Score
33 South Korea .827
35 Japan .823
53 Russian Federation .770
66 Ukraine .748
89 China .722
148 India .597
167 Pakistan .476
170 Afghanistan .278

Out of the the 170 countries, Afghanistan has by far the lowest score.  Out of 170 countries, if 85 is the median rank, the world’s two largest countries, China and India, with populations of 1.4 billion people each, are both below that.  Ukraine will be lowered by the unjustified and inhumane Russian invasion, and the flight of over 5 million women and children.

We now cover the Middle East, where Iran is highlighted for siding with Russia in its invasion of Ukraine and supplying it inhumanely used drones, and also the country of women revolting against dress codes and their cruel enforcement.  The youth are also demonstrating against the religious dictatorship.  Iran is also developing nuclear weapons and part of the humanitarian crisis in Yemen.  Saudi Arabia and other OPEC+ states are not part of sanctions against Russia.

Rank Country Index Score
24 UAE .856
27 Israel .844
97 Qatar .713
97 Bahrain .713
102 Saudi Arabia .703
110 Oman .675
123 Kuwait .653
125 Iran .649
127 Jordan .646
136 Egypt .627
160 Palestine .571
162 Sudan .556
165 South Sudan .541
166 Iraq .576
168 Yemen .388
169 Syria .375

Yemen and Syria have been afflicted with inhumane wars, starvation, and forced flight.

Posted in 2015 Fundamental Physics Prize, 2015 Nobel Prize in Physics, 2016 Election, 2016 Primaries, 2017 Georgia Special Election, 2017 South Carolina Special Election, 2018, 2018 California Primary, 2018 Global Climate Analysis, 2018 Midterm Election, 2020 Election, 2020 Primaries, 2022 Election, A Wrinkle in Time, Abortions, About This Blog, Uncategorized | Leave a comment

The United States Women’s Inclusion, Justice, and Security Index of 2020

We summarize the Georgetown Institute for Women, Peace, and Security (GWIPS) 2020 indexing of the status of women by state, in the areas of Inclusion, Justice, and Security.  We then compare this to the new imposition of laws limiting abortion in the states, after the Dobbs decision throwing out the previous federal Constitutional right to abortion in Roe v. Wade, which lasted five decades.

The topics rated under Inclusion, Justice and Security are shown in the following diagram from the report.

The Dobbs ruling will affect all four topics under Justice and Inclusion each, and Healthcare affordability under Security.

Here is a map of the index for each state, using colors of traffic signals:  Green for good, Yellow for serious decisions, and Red for complete denial of rights of passage.

We note that New England does best, and Northern states and the West coast do good at a half or better.  The ancient South does poorly to worse and worst.

Here is the current abortion laws status of the states from the Center for Reproductive Rights:

We note that the maps are similar, but the abortion restrictions are even more severe in more states than the overall 2020 pattern.  Yellow in the above map signifies abortion is still protected, while Yellow in the index is a score below half.

Nationally, Democratic women hold about 20% of state legislature seats, and Republican women hold about 9%.  The best states for women in the legislature is Nevada with 52%, and Colorado with 46%.  The worst states are West Virginia with 13%, and Mississippi with 14%.

There is an almost unbelievable difference in evaluation of women’s equity needs between the political parties, with independent men closer to Republicans, and independent women closer to Democrats.   In their polling, starting with do you think that there is full equality for women, Yes is only 12% for Dem women and 15% for Dem men, while Yes is 57% for Rep women and 67% for Rep men.  It’s almost as if they are watching different news channels!

In do you think that access to abortion is important to women’s rights, very important has Yes at 72% for Dem men and 69% for Dem women, compared to 19% Rep women and 15% for Rep men.  Independent men and women are at 40%.  Adding in the somewhat important result gives Yes at: Dem men 94%, Dem women 88%, Rep women 36%, and Rep men 39%.

On the importance of working on women’s rights:  very important has Dem women 74%, Dem men 63%, compared to Rep women at 27% and Rep men at 21%.  Adding in the somewhat important answers:  Dem women 95%, Dem men 92%, Rep women 70%, Rep men 61%.  Keep in mind, that the survey and report was written before the overturning of Roe v. Wade.

California in the 2020 Index was ranked 15th out of 51 including D.C. with a score of 0.564.  It’s strength was access to reproductive health care, with only 3% of women not living in a county with an abortion provider, the second best nationally, behind only D.C.  This was compared to the US access of only 62.0%, way back in pre-Dobbs of 2020.

Seven key legal protections for women was 71.4% for California compared to 39.9% for the US average in 2020.  Maternal mortality in California was a low 17.6 score, compared to 29.7 as a US average, over the range of per capita deaths.  One drawback, was a 33.3% in discriminatory attitudes compared to a US average of 28.4%.

California’s weakness was safety walking alone in a neighborhood at night, where California only had 40.7%, compared to the US average of 56.1%.  Gun deaths, however, were a low 1.8, versus the US average of 3.3.

California’s rather average overall score is because:  it’s full-time employment of women was 40.5% compared to the US average of 42.5%; working but poor was 5.1% compared to the US average of 5.6%; representation in state legislature was 31.7% compared to 29.5%; and college completion was 34.6% compared to the US 33.0%.

Almost half — 45% — of female state legislators in California are Hispanic, the highest share of any state.


Posted in 2022 Election, Abortions, Affordable Care Act, Big Data, Children, Congress, Constitution, Democracy, Education, Equal Treatment Under the Law, Governors and State Legislatures, Health Care, Income, Politics, Poverty, Supreme Court, Upward Mobility, Women’s Rights | Leave a comment

My Opinions on Inflation, Political Policies, and Abortion Economics

My Political Opinions on Economics and the Midterm Elections

In contrast to my data articles, which I separate, I’m just going to pack my economic political opinions into this one.

Although I read, follow, and attend webinars on economics, I am not qualified in this.  So what I write are opinions.  Democrats are about to be destroyed in the midterms because of inflation.  Yet in the latest webinar with Economist Paul Krugman at the Graduate Center of the City University of New York, it was pointed out that monthly inflation is 0.4% per month, or at a rate 4.8% a year.  Yet the actual year inflation quoted in the media for the maximum frightening effect is around 8.5%.  That has already occurred and can’t be changed by either party.  While a standard has been set at 2% a year, the economists complained that there is no reason for that and 4% to 5% a year is fine also.  

The Republican congress has no new ideas other than a new infusion of Reagonomics of explicit tax cuts for the wealthy.  The UK just tried this, it messed up the value of the pound, and the markets, and PM Liz Truss only lasted 44 days.  We will be stuck with the new House for two years, and the new Senators for six long years.  Unfortunately, Republicans also plan to cut Social Security and Medicare, and who knows what else.  That is not even elaborating the fealty of the Rs to Lord Trump and his egomaniacal con that he won the election despite being 7 million votes short.  And following that with the Insurrection.  Not to mention plans for a national ban on abortions, and perhaps taking away other rights.  And abandoning Ukraine and fighting climate change.

The price of oil has started to decline again in the US as more refineries have finished their summer repair work.  Paul Krugman in The NY Times argues that oil is still low on a historical basis, and is not something that should favor one party over the other.

The Rs are fighting the mild educational debt reduction program, which will cost $400 billion stretched over 30 years.  This despite their Trump tax cut for the wealthy of $2 billion over 10 years.  Even in a four year public university, costing say $40,000 a year, the effect is a $2,500 per year federal aid, or 6.25%, or 1/16 th.

There are 3.7 million births in America per year, and about 860,000 abortions a year.  Most of these are to unmarried women, who cannot afford the cost of raising a child.  With a Federal Forced Birth law, this increase of 23% of children has to be met with federal funding of $310,000 to raise them to age 17, where they might go to college.  Since many of these mothers are in poverty, or will be when raising a child, the state or federal government will have to provide this aid.  I had once calculated that the cost of K-12 education on top of that was about $150,000, or 50% more, for a total of $460,000.  For the 860,000 new children, the cost to the mothers is $267 billion over the next 17 years plus maternity care and time off for maternity leave.  The total cost is $400 billion.  But remember, this is just the program for one year of births.  This commitment has to be remade every year forever.  It is about a half of the military budget!  And yet, Rs are complaining about the college aid program of $400 billion just once, to be distributed over 30 years.  By the way, it contributes little to our economy without giving these children fully funded college educations where they are capable of it, adding another $160,000 or 50% to the costs for some, and less for two year colleges or technical schools.  If the status quo remains of states banning abortions separately, they are gaining $460,000 for each woman who goes out of state for an abortion, even without considering college.  These states can at least fund the travel and abortions, other than they probably all have laws that ban any aid to an abortion, as does the federal government.

Posted in 2022 Election, Abortions, Affordable Care Act, Children, Climate Change, Congress, Democracy, Economies, Education, Equal Treatment Under the Law, Health Care, Inflation, Oil, Politics, Supreme Court, Trump Tax Cuts, University Funding, Women’s Rights | Leave a comment

Freedom on the Net 2022 Ratings by Country

Freedom on the Internet and in social media in 2021-22 shows that only 18% of global internet users are assessed as Free, 34% as Partly Free, and 37% as Not Free.  11% are in countries that were not assessed.  The judgements were made by country experts for Freedom House.

Countries’ internet freedom were rated under all important characteristics, divided into the three categories, with points that could total 100.  They are:

A.  Obstacles to Access, 0-25 points;

B.  Limits on Content, 0-35 points; and

C.  Violation of User Rights, 0-40 points.

Totals from 100-70 are called Free, from 69-40 are called Partly Free, and below 40 are called Not Free.

For eight years in a row, China has been at the bottom of the ratings.  The outtake from the report lists the main rights being denied worldwide, and gives in detail the abuses by China.


Two thirds of the World’s population are in countries where people can be punished for free expression online.

Countries are now engaged in splitting the internet into national segments, largely to present propaganda, but also to secure private data over the web.   47 out of 70 countries examined limited access of other countries information.

The maps below show, somewhat like traffic signals colors, the freedom rankings of the 70 countries covered.  Green designates Free, with 17 countries.  Yellow denotes Partly Free, with 32 countries, and Purple denotes Not Free, with 21 countries.  Gray countries, mostly in Africa, were not assessed.

We start with North and South America, where only Venezuela and Cuba were Not Free.  These bad boys had total scores of:  Venezuela, 30; and Cuba, 20.

The major countries here are:  the United States, 76; Mexico, 61; Canada, 87; Brazil, 65; and Argentina, 71.

The next map covers the rest of the world.

The major Free European Countries rated are:  UK 79; Germany 77; France 76; Italy 75.  In the Far East the Free countries are Japan 77; Australia 76 ; and Taiwan 79.  In Africa, there is Free South Africa at 73.  The country of India, with a similar 1.4 billion population as China has, is only Partly Free, at 51.

In the current unwarranted and illegal invasion of Ukraine by Russia, there is the crucial question of whether Russians and the population of Russia’s allies are informed of the atrocious, inhumane, and illegal attacks being carried out in Ukraine.  They aren’t — all being in the Not Free zone.  Hence, the real world dangers of internet censorship.

Ukraine itself is Partly Free at 59.  Russia is 23, and Belarus is 28.   Direct drone supplier of Russia is Iran at 16.  Economically complicit are also China, the bottom, at 10, Saudi Arabia at 24, and perhaps at the edges, Venezuela at 30.  Hungary has dropped 69 places in press freedom under Victor Orban, and 11 in the Democracy Index, but managed a 69 at the top of Partly Free in the Internet index.

This is the link to the full report Freedom on the Net 2022.


Posted in Affairs of State, Algorithms, Big Data, China, Communications, Cybersecurity, Democracy, Democracy Ratings, First Amendment, Freedom of Speech, Freedom of the Press, Freedom to Assemble, Freedom to Petition, Freedoms, Infrastructure, Iran, Middle East, NATO, Putin, Religion, Russia, Turkey, Ukraine, United Nations | Leave a comment

Democracy Survey Details of Countries of Current Concern

We go back to the International Democracy Survey of 2022 and focus in more detail on countries of current concern to understand how they have entrapped and suppressed their populations to live in dictatorships.

The first two components are the Electoral Democracy Index (EDI) of 40 components, and the Liberal Component Index (LCI) of 29 components.  These are combined into the main Liberal Democracy Index (LDI).  Then there are the Egalitarian Component Index (ECI), the Participatory Component Index (PCI), and the Deliberative Component Index (DCI).

We start with Iran, which theocracy is seriously beating, arresting, and killing women and men and the youth protesting the total religious control of all aspects of their lives.  They are also selling modern drone bombs to Russia to kill civilians and destroy their infrastructure in the invasion of Ukraine.  These are just their new offenses.  They are still enriching Uranium and not signing a new nuclear development ban.  Iran has cut its internet.

We then follow this with Russia, which has invaded Ukraine with false excuses and new laws to imprison protesters, and even those who say the word “war”.  They have censored the regular internet.  As part of their urging Ukraine to concede, they are committing all manner of war crimes.  They will now force Belarus to join and also continue to be a launching territory.  We contrast this to the young democracy of Ukraine.  Russia has also cut off most natural gas to Europe, with winter coming.

Finally, the OPEC+, which includes Russia, has cut international oil production by 2 million barrels per day, or 2%.  This will send the price of gasoline up increasing inflation, just 1 month before the US midterm election.  Despite the fact that the US oil industry has not recovered its refining capacity which keeps US prices high, Democrats and President Biden are being blamed for this part of the recurrence of the price increase of gasoline.  Inflation is a world-wide occurrence.  It is occurring by Russian cutbacks and sanctions on Russian oil and natural gas, as well as supply chain disruptions from the pandemic.  We have an article on the many ways that drivers can save gas, which is the appropriate answer to fight OPEC+.

We add the oil countries of Saudi Arabia and Venezuela to our Democracy table.  Venezuela also is the source of many seeking asylum at our Southern Border.  Saudi Arabia has been generously funding Trump son-in-law Jared Kushner, and Trump’s golf courses.

We also throw in China, where President Xi is about to give himself an unprecedented third 5 year term.  They also heavily censor the internet.

For comparison, we add a struggling democracy, the United States, which has an open internet, but that turns out to also be a source of voluntary misinformation and propaganda, as well as truth.

The Democracy component table has the Country and the LDI, EDI, LCI, ECI, PCI, and DCI component values on a scale of 1 to 10.  We also include the Ranking of the Country in each component.  There are 179 countries ranked in the Survey.

Country LDI EDI LCI ECI PCI DCI
Iran 1.2 142 1.8 159 3.3 136 5.5 108 1.3 170 5.0 127
Russia 1.0 151 2.6 139 2.4 155 5.4 110 4.3 125 3.0 151
Belarus 0.4 175 1.8 158 0.8 175 7.4 54 1.6 160 1.2 169
Ukraine 3.2 99 5.2 89 5.4 110 6.7 73 5.7 70 8.1 48
Saudi Arabia 0.4 171 0.2 179 1.7 162 4.6 130 0.7 177 2.5 154
Venezuela 0.7 161 2.2 148 1.7 165 4.0 137 5.0 106 0.4 178
China 0.4 172 0.8 176 1.5 168 3.4 151 1.4 168 3.6 144
United States 7.4 29 8.2 29 9.0 26 6.5 76 6.6 26 7.8 61

Our previous article on the Survey covering more countries but with less detail is here.

The main site for the Survey and other studies is at V-dem.net.

Posted in 2022 Election, Affairs of State, California Oil, Democracy, Democracy Ratings, Donald Trump, Economies, First Amendment, Fossil Fuel Energy, Freedom of Speech, Freedom of the Press, Freedom to Assemble, Freedom to Petition, Freedoms, Gasoline, Immigration Policy, Iran, Middle East, Natural Gas, Oil, Politics, Putin, Religion, Russia, Saudi Oil Imports, Ukraine, US Oil, World Oil Exports, World Oil Usage, Yemen | Leave a comment

UC Irvine STEM Rankings and Scores in The Times World University 2023 & 2022

We show the evaluation scores for UC Irvine overall in The Times World University rankings for 2023, and rankings and scores for four of the STEM categories of 2022.  The four categories which we choose are Physical Sciences, Engineering and Technology, Computer Science, and Life Sciences.

In the 2023 World University Rankings UC Irvine was tied for 95th out of 1,800 universities.  This is an improvement over its 2021 ranking in World Reputation Rankings in the range 126-150th.  In 2022, UC Irvine was ranked 87th in the US College Ranking, which includes many colleges besides research universities.

UC Irvine has 36,655 students, and a 16.9 student to staff ratio.  It has 28% international students, and a 52:48 female to male student ratio.  On campus room and board is $16,135 a year, and the out-of-state tuition and fees is $43,481 a year.  The salary after ten years is $56,000.

The following table has the international field ranking and scores of 2022 for:  Overall; Citations; Industry Income; International Outlook; Research; and Teaching, for the Overall University in 2023, and in the four STEM areas which we have chosen.

Category University Physical Sciences Engineering & Technology Computer Science Life Sciences
International Ranking Tied 95 59 100 Tied 83 126-150
Overall 63.6 66.2 55.7 55.9
Citations 93.6 96.9 82.5 91.2 84.3
Industry Income 59.4 46.1 44.3 43.7 47.3
International Outlook 73.2 82.7 81.2 68.7 67.7
Research 51.6 46.9 40.4 42.3 38.9
Teaching 43.5 43.8 42.0 36.1 34.0


Posted in Education, UC Irvine, University Rankings | Leave a comment

California Universities in The Times Engineering Rankings for World Universities for 2022

We first give the top ten internationally, and then the rankings in the top 100 of California research universities in Engineering.

1.  Harvard U.

2.   Stanford U.

3.  UC Berkeley

4.   Massachusetts Institute of Technology

5.   U. Cambridge

6.   Oxford U.

7.   Princeton U.

8.   California Institute of Technology

9.   ETH Zurich

10.   National U. Of Singapore

11.  UC Los Angeles

31.  UC San Diego

41.  UC Santa Barbara

63.  U. Of Southern California

99.  UC Davis

100.  UC Irvine


Posted in Education, UC Berkeley, UC Irvine, UCLA, University Rankings | Leave a comment

California Universities in the Physical Sciences Rankings of The Times University Rankings for 2022

We present the World University rankings in the Physical Sciences top ten, and then the rankings of the main California research universities.  Equal signs designate ties.

  1.  UC Berkeley

=2.  California Institute of Technology

=2.  Princeton U.

=4.  Massachusetts Institute of Technology

=4.  Stanford U.

6.  Harvard U.

7.  U. Of Cambridge

8.  U. Of Oxford

9.  ETH Zurich

10.  Yale U.

14.  UC Los Angeles

=27.  UC Santa Barbara

38.  UC San Diego

59.  UC Irvine

80.  UC Davis

126-150.  U. Of Southern California

176-200.  UC Riverside


Posted in Education, UC Berkeley, UC Irvine, UCLA, University Rankings | Leave a comment

California Universities in The Times Higher Education World University Rankings of 2023

We show the top ten World Universities, which include three California ones, and then the rankings of the other main research universities in California.  Where universities are tied, we use an equal sign.  The ranking is among 1,799 world universities which were ranked.

1.  U. Of Oxford

2.  Harvard U.

=3.  U. Of Cambridge

=3.  Stanford U.

5.  Massachusetts Institute of Technology

6.  California Institute of Technology

7.  Princeton U.

8.  UC Berkeley

9.  Yale U.

10.  Imperial College, London

21.  UC Los Angeles

32.  UC San Diego

63.  UC Davis

64.  UC Santa Barbara

65.  U. Of Southern California

=95.  UC Irvine

=192.  UC Santa Cruz

251-300.  UC Riverside

301-350.  UC Merced

601-800.  San Diego State

We see that California has numbers 3, 6, and 8.  Also, six of the UC campuses rank in the top 100.

Posted in Education, UC Berkeley, UC Irvine, UCLA, University Rankings | Leave a comment

Florida Politics Still in Climate Change Denial

Florida Politics Still in Climate Change Denial

Florida Governor DeSantis is already writing the Hurricane Ian disaster off as a one in 500 year event, implying that there won’t be any climate change effects for 500 years.  This is of course in defense of rapidly expanding Florida real estate, and the Republican’s national backing by the fossil fuel industry. Yes, I know that I shouldn’t be political after a disaster, but I am not starting this, and I am being scientific, not political.

What the one in five hundred years means is that any chosen city would only get hit once in 500 years by another hurricane of category 5 or greater.  But the Governor of Florida has to respond and aid Floridians for many years in dozens of cities, counties, and areas.  The last extreme storm in Florida was category 5 Hurricane Andrew only 30 years ago.  Punta Gorda, near Fort Myers, was devastated by Hurricane Charley in 2004, less than 20 years ago.  But even more importantly, super, almost category 5 Hurricane Ian carved a long coastal swath including Naples, then crossed Florida with high rains and winds, struck Orlando, then repowered to a Catagory 1 over the Atlantic, and then came ashore again at Charleston, South Carolina.  Also, Florida can be attacked by both East and West, and has the gigantic 1,350 miles of coastline, only exceeded by Alaska.

But wait, the intensity of storms is also increasing rapidly with the warming of Gulf and Atlantic Ocean temperature.  Yet still another wait, by the year 2100, less than 100 years from now, the sea level will rise another 3 feet, at least.  Yet finally, the settlement of scenic and recreational ocean, harbor, and river apartments, condos, and homes is also rapidly increasing. 

We will back up these statements using the MSNBC presentation and other sources.

When driving across mountainous terrain, you always find the altitude at the peak of your passage.  Crossing the Everglades, the peak sign we found listed 3.5 feet above sea level.  Two articles ago, you can see that a flood map at 6 feet covers all of the Everglades South of highway 41.  That also means that  maybe 100,000 of the 1.5 million Florida alligators will be finding new homes in the neighborhood. 

Lee County, which contains Fort Myers Beach, Sanibel island and Fort Myers which took the brunt of the incoming eyewall, increase in population from 1970 of 100,000 to over 700,000.  It is one of the hottest increasing national housing areas.

One study says that the Hurricane contained 10% more rain because of climate change.  Forty years of satellite data showed that the probability of a tropical cyclone becoming a Category 3 or higher hurricane increased by 8% per decade due to global warming.  Warmer sea surfaces also slow down storms to allow for more torrential rain, flooding and storm surge.  Finally, the warmer sea surface allow the hurricanes to maintain their strength longer after making landfall.

The following study shows the correlation between the Atlantic water temperature and the energy contained within the tropical storms.

Above are about a dozen factors that increase the total damage to be considered by all Americans, over DeSantis’s minimizing dismissal of the true and scientific susceptibility of Americans to climate change and “natural” disasters.  Oh, and DeSantis is preparing to run for President of these United States, after he get reelected Governor.

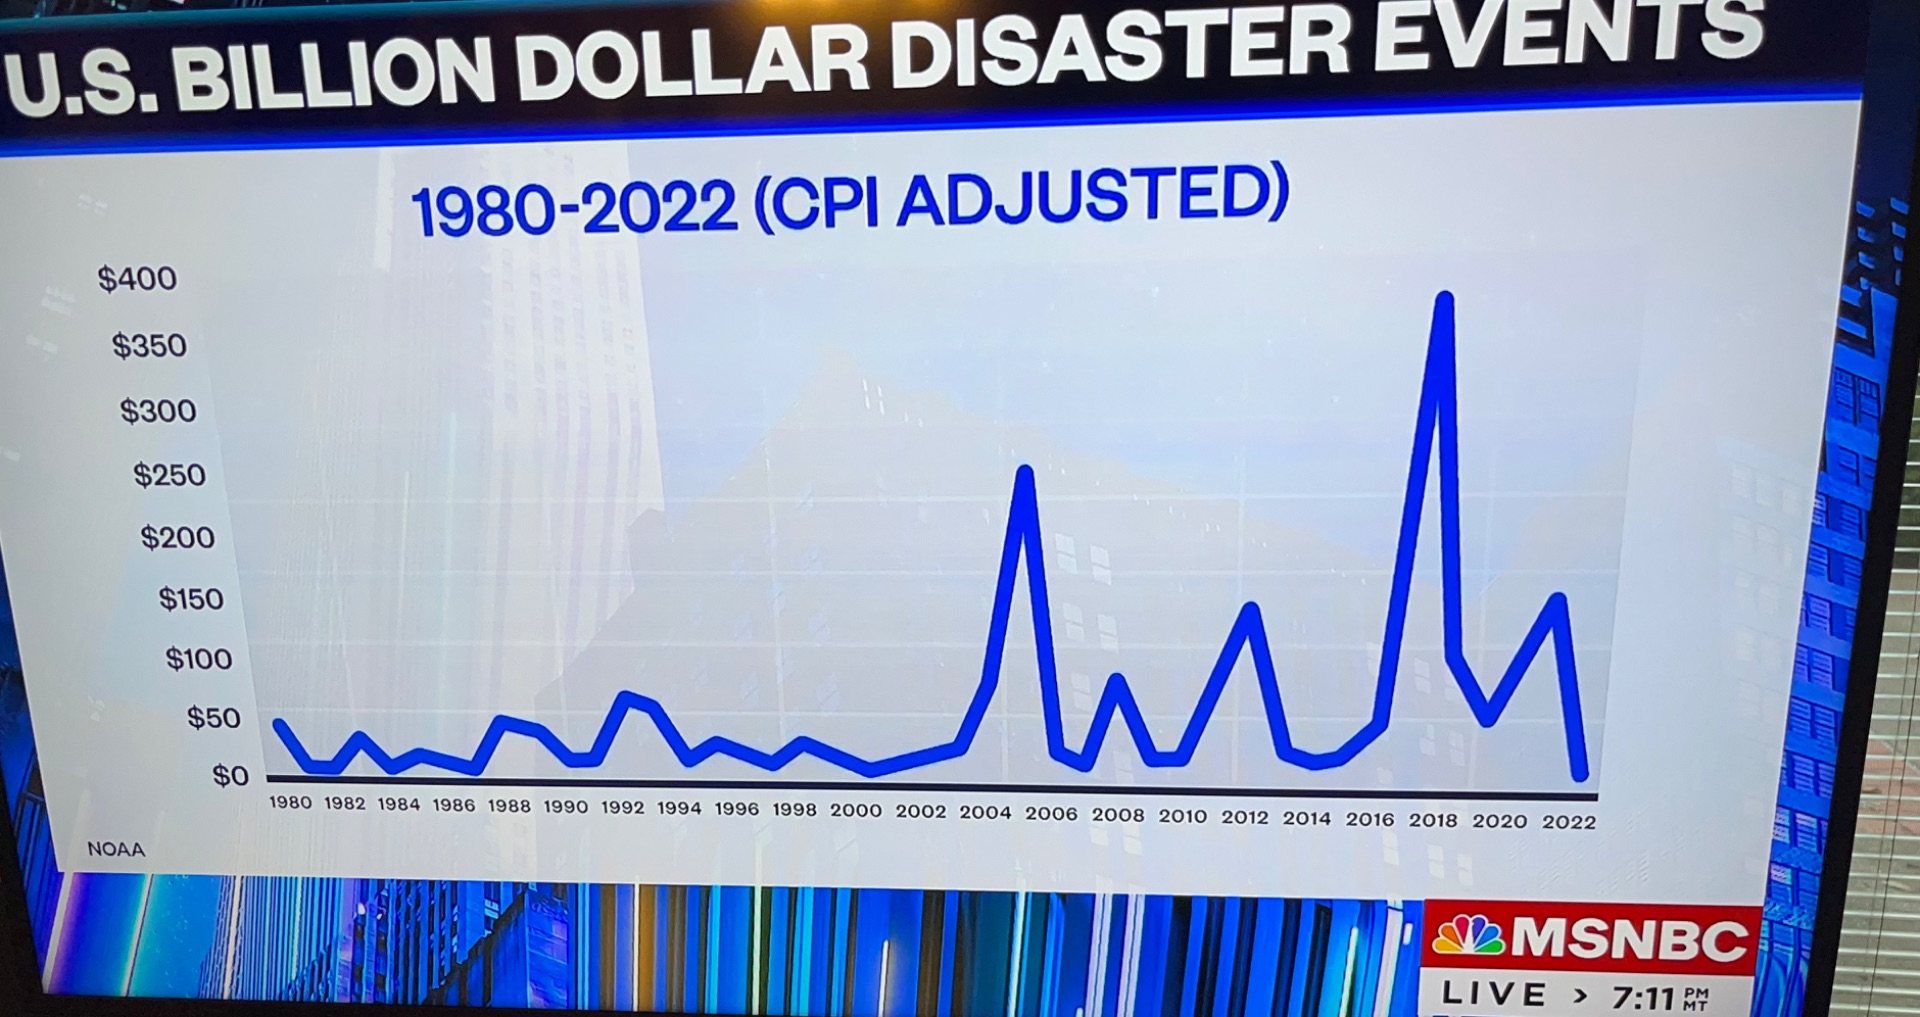
Below is the yearly cost of disaster events of more than a billion dollars each.  The yearly costs are now often above $100 billion a year, and increasing in frequency.

The chart below shows the type of disaster events and their costs and total costs per year.  For 2021, the second highest year, the total of 20 events was $152.6 billion.  The Total Costs for the last five complete years was $788.4 billion.  This is from NOAA’s National Center for Environmental Information and shown on MSNBC.

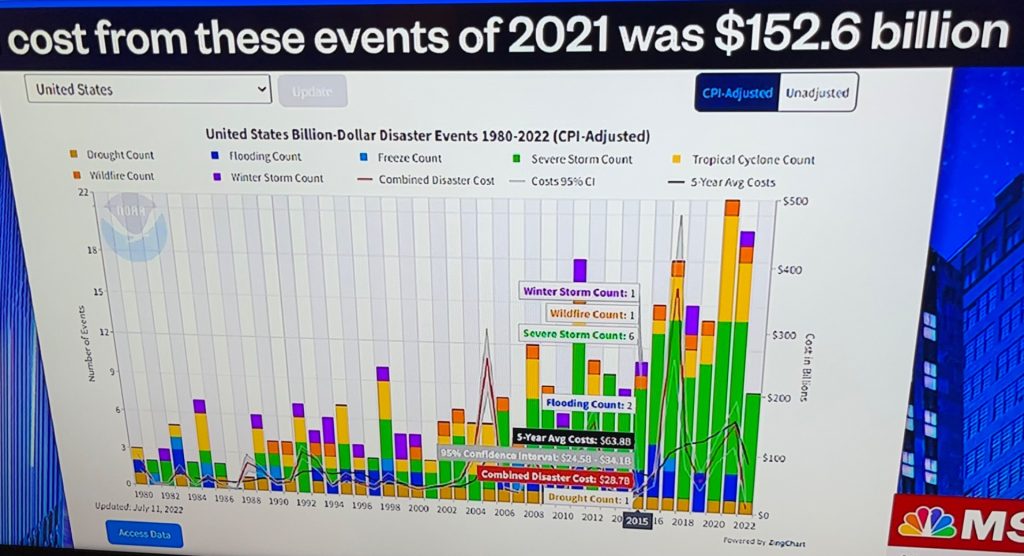
So far in 2022 we are at $200 billion.  Hurricane Ian’s cost is now estimated at over $100 billion, where only $63 billion is covered by private insurance.  A little over that total estimate by the end of the year would place 2022 as the fifth most expensive year.

The five most costly Hurricanes and their dates show that they are all in the last 17 years, proving that the once in 500 year description can be very misleading.

The Biden Inflation Reduction Act contains the largest appropriation yet for mitigating climate change of $369 billion.  This is not even half of the destruction over the last five years of $788 billion, showing that recognition of climate change and working on its prevention is far less costly and disruptive over both the short and long run.

Misrepresenting risk can have serious consequences.  Only 15.4% of households in Florida have flood insurance.  Even people in upper story condos can have their car drowned in underground or ground level parking.  Also, roofs can be removed.  In Orlando, only 2% have flood insurance.  In Lee County of Fort Myers, 28% are covered, and in Naples’ Collins County, 41% are covered.  Misrepresentation can also affect resident from following storm news, from stocking up on food, water, and necessities, and from evacuating when advised or ordered.

While Florida has had a 15 year old legislation to build renewable electrical energy, nothing was done on it.  Florida has only 20% clean energy, and only 7.4% of its energy is renewable.  While Governor DeSantis has become known as the “don’t say gay” governor, the past two term Governor and now Florida Senator Rick Scott was known as the “don’t say climate change” Governor.  Senator Scott is now Chairman of the National Republican Senatorial fund raising Committee.

Posted in Uncategorized | Leave a comment