
- AMO
- ITCZ
- Atmospheric Rivers
- NAO location
- Sea ice and atmospheric circulation
- Tropical-Extratropical Interactions
- Moisture transport into Arctic
AMO
This project is dedicated to determine the impacts of multidecadal variability of the North Atlantic ocean on the large-scale atmospheric circulation in winter on different time scales (decadal, interannual and intraseasonal).
The North Atlantic sea surface temperature (SST) exhibits some basin-wide multidecadal fluctuations with a period of 60-70 years in the observational record (back to the end of the 19th century). This mode of variability is referred as Atlantic Multidecadal Oscillation (AMO), or Atlantic Multidecadal Variability (AMV) since this mode is not a true oscillation (paleoclimatic data suggest that its period has varied in time). When the AMV is in its positive phase, the North Atlantic SST is warmer than normal. When the AMV index is negative the North Atlantic SST is colder than normal. Since the end of the 90’s, the AMV is in its positive phase (see below).
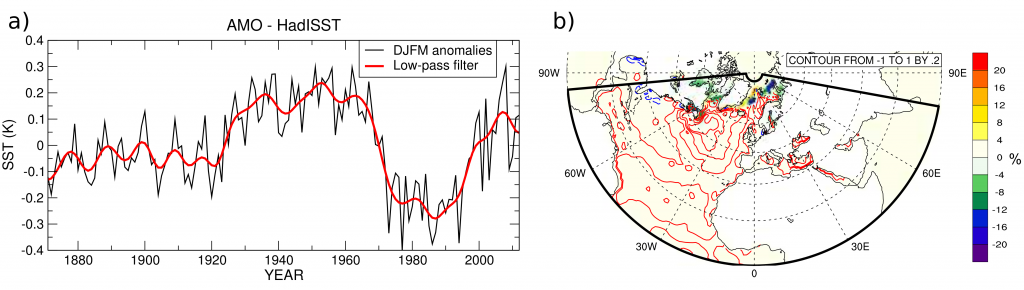 a) Timeseries of AMV in observations (SST averaged over the North Atlantic basin). The interannual anomalies are shown in black, the AMV is in red (low-pass filter of interannual anomalies). b) Anomalies of SST (contour) and sea ice concentration (color) between the positive and negative polarity of the AMV.
The AMV influences numerous climatic phenomena of the Atlantic sector, such as the Sahel monsoon rainfall, the tropical Atlantic cyclonic activity or the Amazonian precipitation. The impacts of the AMO are well understood in summer, but fewer studies have investigated the wintertime atmospheric response to the AMO forcing. In particular, the linkage between the AMO and the NAO (that is the primary mode of atmospheric variability in the North Atlantic in winter) is unclear. At the seasonal timescale, the atmosphere drives the SST anomalies, with little feedback from the ocean on the atmosphere. However, at longer timescale, the SST anomalies associated with the AMV have the potential to impact the atmospheric circulation, especially the NAO.
The AMV is therefore an interesting source of predictability for the climate at the multidecadal timescale. Our team uses both observations and climate simulations to clarify the impact of the AMV on the NAO. In addition with seasonal-mean diagnostics, we also use daily data to examine variability in population of weather regimes and in extreme temperature and precipitation.
Peings, Y. and G. Magnusdottir, 2014: The role of sea surface temperature, Arctic sea ice and Siberian snow in forcing the atmospheric circulation in winter of 2012-2013. Climate Dynamics. In Press.
Peings, Y. and G. Magnusdottir, 2014: Forcing of the wintertime atmospheric circulation by the multidecadal fluctuations of the North Atlantic ocean. Env Res Letters, 9, doi:10.1088/1748-9326/9/3/034018, 8pp.
top
ITCZ
Our current projects look at variability of tropical elongated convergence zones: 1) Dynamics of the Intertropical Convergence Zone (ITCZ) and the South Pacific Convergence Zone (SPCZ) and 2) The states of the east Pacific ITCZ (including the southern, northern, double, equatorial and absent) throughout the annual cycle.
Through collaborations with Prof Padhraic Smyth and his research group we have developed sophisticated spatio-temporal statistical models to identify and quantify features in instantaneous satellite images (available over more than thirty years at high spatial/temporal resolution) including a Markov random field model for identifying the boreal summer ITCZ and the austral summer SPCZ. Labels indicating ITCZ and SPCZ location have been used to quantify seasonal and interannual variability in location, area, and intensity of convection of these two features. A detailed study of the diurnal cycle of the ITCZ has also been conducted and a similar project is currently underway for the SPCZ.
The east Pacific ITCZ is particularly interesting in the boreal spring when it can be located in the northern hemisphere, southern hemisphere, or both simultaneously (the double ITCZ). Our latest collaboration produces a statistical model that identifies the location of the east Pacific ITCZ every three hours for the past 33 years using infrared satellite images. In addition to the three locations mentioned above, the ITCZ can also be located on the equator, which occurs only in strong El Niño years, or absent. Below is a summary of ITCZ location.
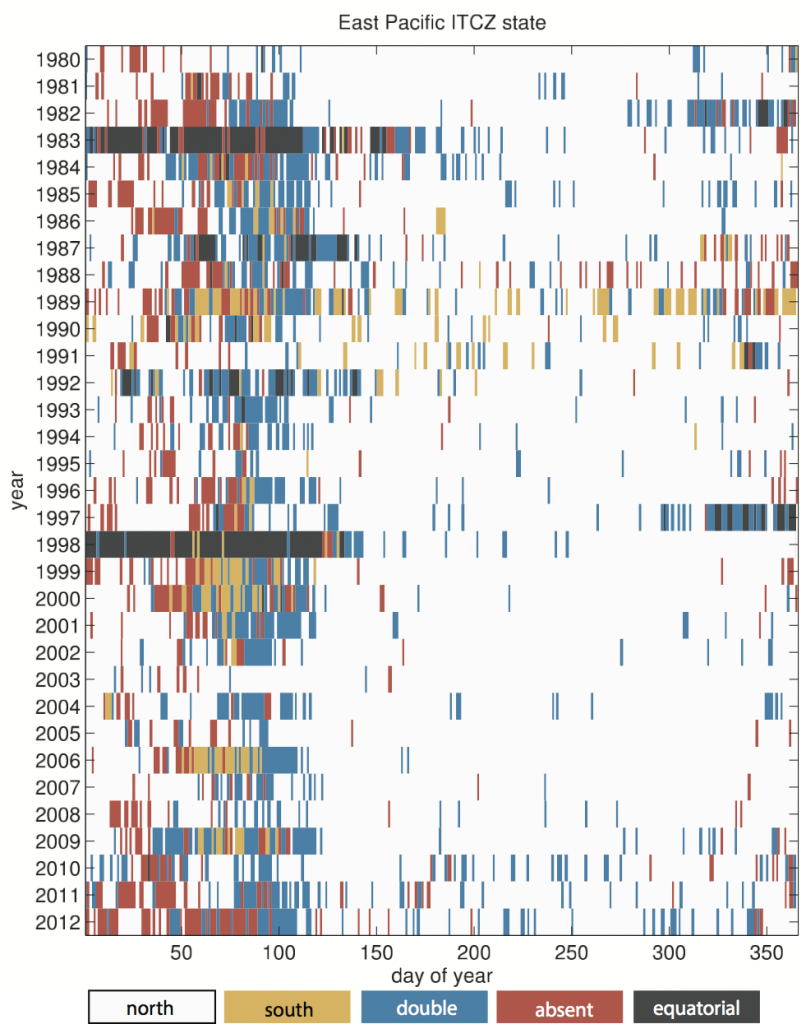 Daily ITCZ state from 1980-2012 based on statistical model using IR satellite images as input. Each ITCZ state is represented as a different color: nITCZ – white, sITCZ – yellow, dITCZ – blue, aITCZ – red, and eITCZ – black.
We are currently exploring the variability of ITCZ location on different time scales and the atmospheric and sea surface conditions associated with each.
Past projects have focused on the breakdown of the ITCZ represented as a strip of positive relative vorticity in the lower troposphere. Initial value experiments in a primitive equation model. Cloud fields in satellite images.
Haffke, C. and G. Magnusdottir, 2013: The South Pacific Convergence Zone in three decades of satellite images. J. Geophys. Res. Atmos., 118, doi:10.1002/jgrd.50838.
Henke, D., P. Smyth, C. Haffke and G. Magnusdottir, 2012: Automated analysis of the temporal behavior of the double Intertropical Convergence Zone over the east Pacific. Remote Sensing of Environment. 123, 418-433.http://dx.doi.org/10.1016/j.res.2012.03.022
Bain, C., J. DePaz, J. Kramer, G. Magnusdottir, P. Smyth, H. Stern and C.-C. Wang, 2011: Detecting the ITCZ in instantaneous satellite data using spatial-temporal statistical modeling: ITCZ climatology in the east Pacific. Journal of Climate, 24, 216-230.
Bain, C., G. Magnusdottir, P. Smyth, and H. Stern, 2010: The diurnal cycle of the ITCZ in the east Pacific. Journal of Geophysical Research – Atmospheres, 115, D23116, doi:10.1029/2010JD014835.
Scharenbroich, L., G. Magnusdottir, P. Smyth, H. Stern and C.-C. Wang, 2010: A Bayesian framework for storm tracking using a hidden state representation Monthly Weather Review, 138, 2132-2148.
Magnusdottir, G. and C.-C. Wang, 2008: Intertropical convergence zones during the active season in daily data, J. Atmos. Sci., 65, 2425-2436.
Wang, C.-C., and G. Magnusdottir, 2006: The ITCZ in the Central and Eastern Pacific on Synoptic Timescales. Mon. Wea. Rew., 132, 1405-1421.
Wang, C.-C., and G. Magnusdottir, 2005: ITCZ breakdown in three-dimensional flows J. Atmos. Sci., 62,1497-1512.
top
Atmospheric Rivers
Atmospheric rivers (ARs) are filamentary features that play a significant role in the horizontal transport of atmospheric moisture poleward. They develop over short sub-seasonal synoptic scale timescales and form spatially narrow plumes that can stretch over thousands of kilometers low in the troposphere (Newell et al., 1992). ARs represent an integral link between the tropics and extratropics and furthermore, represent an important interaction between weather and climate. The effect of ARs making landfall is well documented, particularly along the western coast of North America, where they play an important role water resource management. Predictability of these landfalling events is an active area of research since ARs are linked to extreme flooding. Significant advances have been made in the characterization of the meteorological and hydrological their on land, however, many questions remain about the large-scale mechanisms influencing their intensity and landfalling characteristics.
 Animation in total precipitable water (in color, cm) overlain by integrated vapor transport (contours, kg m-1 s-1) of an atmospheric river making landfall on March 25th 2005.
One of the difficulties an in-depth investigation of ARs is their ever-present occurrance over the Pacific. The first part of this project focused on landfalling North American ARs in reanlaysis over the past thirty years and the development of an identification and tracking method to constrain their movement. Our analysis shows a close association of AR landfalling behavior with extratropical dynamics, particularly anticyclonic Rossby wave breaking over the eastern Pacific. The results of this work are summarized in Payne and Magnusdottir (2014).
We have recently expanded this project to look at ARs in climate projections for the end of the century, focusing on the link between ARs and jet dynamics.
Payne, A.E. and G. Magnusdottir, 2014: Dynamics of landfalling atmospheric rivers over the North Pacific in thirty years of MERRA reanalysis. J. Climate, 27, 7133-7150.
top
Sea ice and atmospheric circulation
Sea-ice variability and the North Atlantic Oscillation on intraseasonal, interannual to decadal time scales. Examined the feedback between the NAO and the Greenland Sea-ice dipole (GSI, the dominant mode of sea ice variability in North Atlantic sector of the Arctic in winter) in observations and found that a positive NAO index will lead to a positive GSI, which in turn leads to a negative NAO on intraseasonal time scales. However in the Pacific sector of the Arctic the intraseasonal interaction is primarily between Berings Sea sea ice anomalies and the West Pacific (WP) pattern resulting in a positive feedback with interesting possible consequences on North American rainfall.
On longer time scale we resorted to modeling to examine interaction between atmosphere and sea ice. For example our numerical simulations suggest that the intense Arctic sea ice melt in recent years have promoted the negative Northern Annular Mode (NAM, hemispheric signature of the NAO) in late winter. The sea ice anomalies impact the NAM by driving an anomalous upward propagation of Rossby waves from the troposphere into the stratosphere, that results in a weakening of the stratospheric polar vortex.
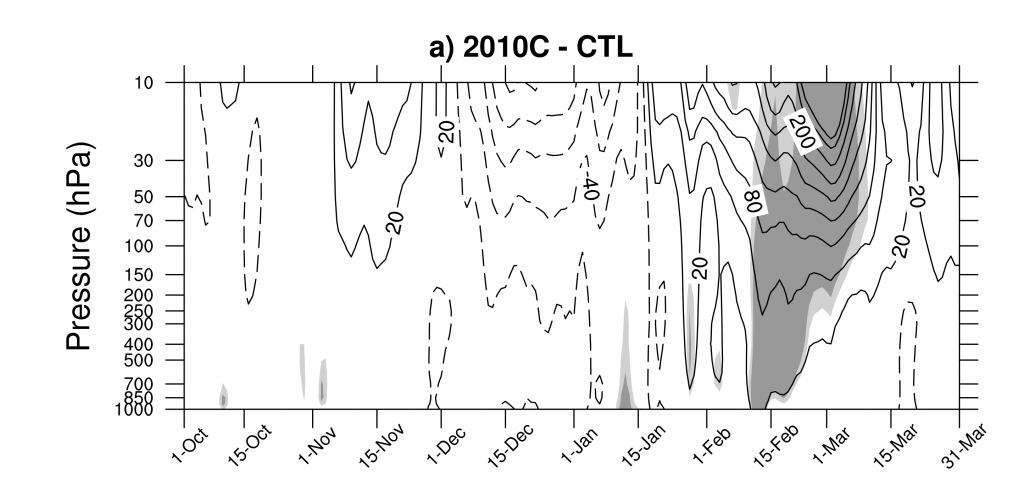 Time vs pressure plot of daily anomalies of the polar cap (north of 60N) geopotential height in a numerical experiment with prescription of recent sea ice loss (2007-2012 anomalies). Contour interval is 30m, shading indicate anomalies that are significant at the 95% confidence level.
Peings, Y. and G. Magnusdottir, 2014: Response of the wintertime Northern Hemispheric atmospheric circulation to current and projected Arctic sea ice decline: a numerical study with CAM5. J. Climate, 27, 244-264.
Matthewman, N. J., and G. Magnusdottir, 2012: Clarifying ambiguity in intraseasonal Southern Hemisphere climate modes during austral winter. Journal of Geophysical Research – Atmospheres. J. Geophys. Res., 117, D3,doi:10.1029/2011JD016707, 2012.
Matthewman, N. J. and G. Magnusdottir, 2011: Observed interaction between Pacific sea ice and the Western Pacific pattern on intraseasonal time scales. Journal of Climate, 24, 5031-5042. doi 10.1175/2011JCLI4216.1. (PDF)
Strong, C. and G. Magnusdottir, 2011: Dependence of NAO on coupling with sea ice. Climate Dynamics, 36:1681–1689. DOI:10.1007/s00382-010-0752-z.
Strong, C., and G. Magnusdottir, 2010: The role of Rossby wave breaking in shaping the equilibrium atmospheric response to North Atlantic boundary forcing Journal of Climate, 23, 1269-1276.
Strong, C., and G. Magnusdottir, 2010: Modeled winter sea ice variability and the North Atlantic Oscillation: a multi-century perspective Climate Dynamics, DOI 10.1007/s00382-009-0550-7.
Strong, C., G. Magnusdottir and H. Stern, 2009: Observed feedback between winter sea ice and the North Atlantic Oscillation.Journal of Climate, 22, 6021-6032.
G. Magnusdottir, C. Deser and R. Saravanan, 2004: The effects of North Atlantic SST and sea-ice anomalies on the winter circulation in CCM3. Part I: Main features and storm-track characteristics of the response. J. Climate, 17, 857-876.
Deser, C, G. Magnusdottir, R. Saravanan and A. Philips, 2004: The effects of the North Atlantic SST and sea-ice anomalies on the winter circulation in CCM3. Part II: Direct and indirect components of the response. J. Climate, 17, 877-889.
top
NAO location
Uncertainty estimates of climate patterns including the North Atlantic Oscillation (NAO). How are the two centers of action of the NAO varying in time? Introducing an augmented NAO index. How is cyclonic Rossby wave breaking on each side of Greenland associated with variability in location of the northern center of action?
 The mobile NAO on decadal time scales from 20th century reanalysis data. The animation shows 20-yr running windows of EOF1 SLP over DJFM in the North Atlantic area. The windows are partially over- lapping so that each window follows another by shifting over one year for a total of 118 20-yr periods.
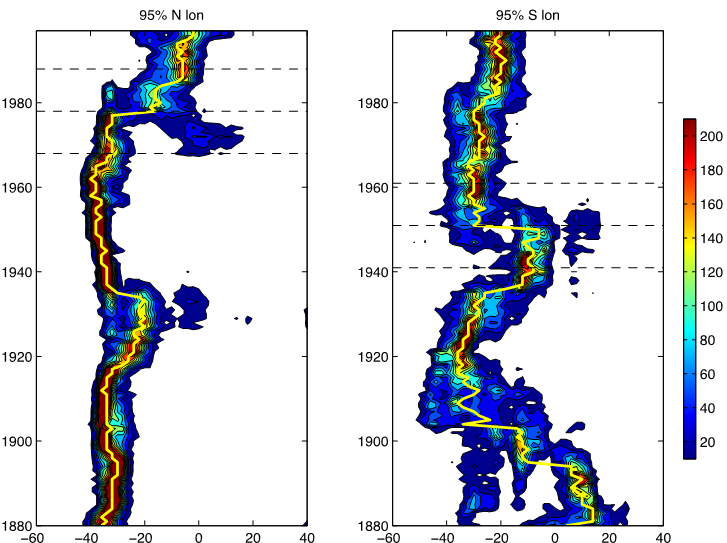 Distribution of the longitude of occurrence of individual NAO centers of action vs 20-yr running windows. On left the northern one, on right the southern one. Yellow curve shows longitude of centers of action from the estimation in original data. The y axis shows the 10th year of a 20-yr period. (Fig. 8 in Wang et al 2014).

An augmented NAO index. In order to account for movement of the NAO centers over time we defined a so-called Angle index that is a measure of the offset in longitude between the two centers of action of the NAO. If the Angle index is zero both nodes are on the same longitude, if the index is negative the northern node is tilted towards the west. The plot shows the smooth NAO Index defined so that the corresponding pattern (NAO) remains spatially stationary for the entire analysis time but a new index is calculated for each 20-yr period (by regression) vs the Angle Index. The progression of time is shown in color, early 20-yr periods in blue, late 20-yr periods in red as shown on the color bar. (Fig. 2b in Wang et al 2012).
Wang, Y-H., G. Magnusdottir, H. Stern, X. Tian and Y. Yu, 2014: Uncertainty estimates of the North Atlantic Oscilation. J. Climate, 27, 1290-1301 .
Wang, Y.-H., G. Magnusdottir, H. Stern, X. Tian and Y. Yu, 2012: Decadal variability of the NAO: Introducing an augmented NAO index. Geophys. Res. Lett., 39, L21702, doi:10.1029/2012GL053413.
Wang, Y.-H., and G. Magnusdottir, 2012: The shift of the northern node of the NAO and cylonic Rossby wave breaking.Journal of Climate, 25, 7973-7982, doi: http://dx.doi.org/10.1175/JCLI-D-11-00596.1
top
Tropical-Extratropical Interactions
Dynamical interactions (through Rossby wave dynamics) between the mid-latitudes and the tropics, between tropospheric flow and stratospheric flow. Atmospheric teleconnections, Rossby wave propagation, nonlinear saturation and Rossby wave breaking. Rossby wave breaking resulting in nonlinear reflection, vs Rossby wave breaking resulting in absorption of wave activity and therefore no long-range effects.
 Effects of nonlinear reflection on the NAO. Anamolous 300 hPa streamfunction 5 days following anticyclonic Rossby wave breaking for a) composite of reflective events (~25%), b) composite for non-reflective events (~75%). Winter (DJF) from NCEP reanalysis data. Fig. 3 from Abatzoglou and Magnusdottir (2006b)
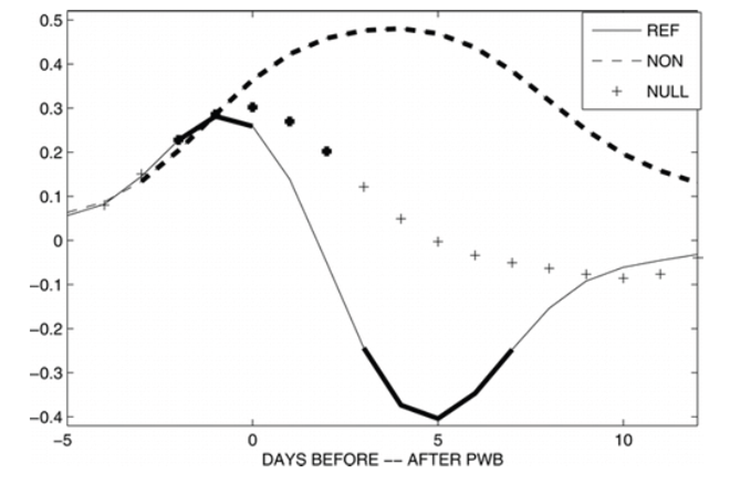 The corresponding NAO index from the composite of reflecting events (solid curve), from the composite of non-reflecting events (dashed curve). Following nonlinear reflection the NAO index drops to negative values as wave activity is flushed out of the region, whereas following non-reflective breaking the NAO gets more positive. Fig. 7 from Abatzoglou and Magnusdottir (2006b).
Payne, A.E. and G. Magnusdottir, 2014: Dynamics of landfalling atmospheric rivers over the North Pacific in thirty years of MERRA reanalysis. J. Climate, 27, 7133-7150.
Wang, Y.-H., and G. Magnusdottir, 2012: The shift of the northern node of the NAO and cylonic Rossby wave breaking.Journal of Climate, 25, 7973-7982, doi: http://dx.doi.org/10.1175/JCLI-D-11-00596.1
Wang, Y-H. and G. Magnusdottir, 2011: Tropospheric Rossby wave breaking and the SAM. Journal of Climate, 24, 2134-2146. doi: <a style=”color: #005c9c”
Strong, C., and G. Magnusdottir, 2010: The role of Rossby wave breaking in shaping the equilibrium atmospheric response to North Atlantic boundary forcing Journal of Climate, 23, 1269-1276.
Strong, C., and G. Magnusdottir, 2009: The role of Rossby wave breaking in the Pacific Decadal Oscillation Journal of Climate, 22, 1819-1833.
Strong, C., and G. Magnusdottir, 2008: How Rossby wave breaking over the Pacific forces the North Atlantic Oscillation,Geophys. Research Letters, 35, L10706, doi: 10.1029/2008GL033578.
Strong, C., and G. Magnusdottir, 2008: Tropospheric Rossby wave breaking and the NAO/NAM, J. Atmos. Sci., 65, 2861-2876.
Abatzoglou, J.T., and G. Magnusdottir, 2007: Correction to “Wave breaking along the stratospheric polar vortex as seen in ERA-40 data”, Geophys. Research Letters, 34, L11805, doi: 10.1029/2007GL030608.
Abatzoglou, J.T., and G. Magnusdottir, 2007: Wave breaking along the stratospheric polar vortex as seen in ERA-40 data,Geophys. Research Letters, 34, L08812, doi: 10.1029/2007GL029509.
Abatzoglou, J.T., and G. Magnusdottir, 2006: Opposing effects of reflective and non-reflective planetary wave breaking on the NAO. J. Atmos. Sci., 63, 3448-3457.
Abatzoglou, J.T., and G. Magnusdottir, 2006: Planetary wave breaking and nonlinear reflection: Seasonal cycle and interannual variability J. Climate, 19, 6139-6152.
Abatzoglou, J.T., and G. Magnusdottir, 2004: Nonlinear planetary wave reflection in the troposphere Geophys. Research Letters, 31, No. 9, 01 May 2004.
top
Moisture transport into Arctic
In a new project we are concentrating on moisture transport into the Arctic and how it may lead to an increased greenhouse effect both directly and because of increased cloudiness, ultimately affecting the surface energy balance and sea-ice concentration.
top