
Below are some samples of my previous CFD, and thermal analysis work. This page is for educational purpose only (please use these info/plots with proper citation to this page). Note: The models and analyses presented below are highly simplified to protect proprietary info.
Over the past decades, I have worked on various CFD, and thermal analysis / design projects using either commercial software (Ansys AEDT, Icepak, Thermal Desktop, Flotherm, Star-CCM+, OpenFOAM, and Sinda/Fluint among others), or other in-house developed codes. This sort of early stage analysis is extremely handy in navigating towards a more reliable and durable product. Design, analysis, manufacturing and optimization of each of these products, parts and processes involve a large amount of detail which is outside the scope of this blog. If interested, please email for more details.
- Space applications require a vast array of techniques and equipment for thermal analysis and management. The surface temperature of a GPS satellite and its components is shown here under a given solar loading and internal heat dissipation scenario. The color scheme is intentionally chosen to magnify the temperature gradients for easier visual inspection. Various failure scenarios can be studied for optimum operation contingency.

- Power sources, and battery packs are undoubtedly among the most critical units of a system. Below, samples of my prior work are shown in simulating two battery packs and a radioisotope thermal generator (RTG). Temperature profiles are shown for highly simplified models of the original product.


- IR noise control / reduction is crucial for thermal imaging systems / sensors (or in general for IR, IIR, LWIR, SWIR, and NIRCAM imaging). The internal heat not only shortens the life span of IR imaging components / systems, but also it can register as noise to the sensor. Therefore, the internal radiative heat visible to the IR sensors must be minimized, and accounted for in order to reduce noise. This is particularly important for long range IR systems. Below, a simplified IR camera is shown where the noise due to internal radiative heat is integrated over the sensor FOV and is optimized.

- DCIR and ACIR losses are detrimental to pcbs and components alike. Thermal impacts of these resistive losses can be simulated and taken into account both at board and system levels. An example of a project I have worked on is shown below. These losses are typically <10% of the active heat dissipation at steady state, but yet play a critical role in modern day passively cooled electronics.


- Inductive thermal coupling is analyzed below for a wireless charger. The stand, the grip and the charging pad are made out of different materials with different conductivities, and different radiative properties. At max charging rate, for this charger, the pad temperature rise is found to be ~13C consistent with the lab measurements. No solar radiation is considered here.


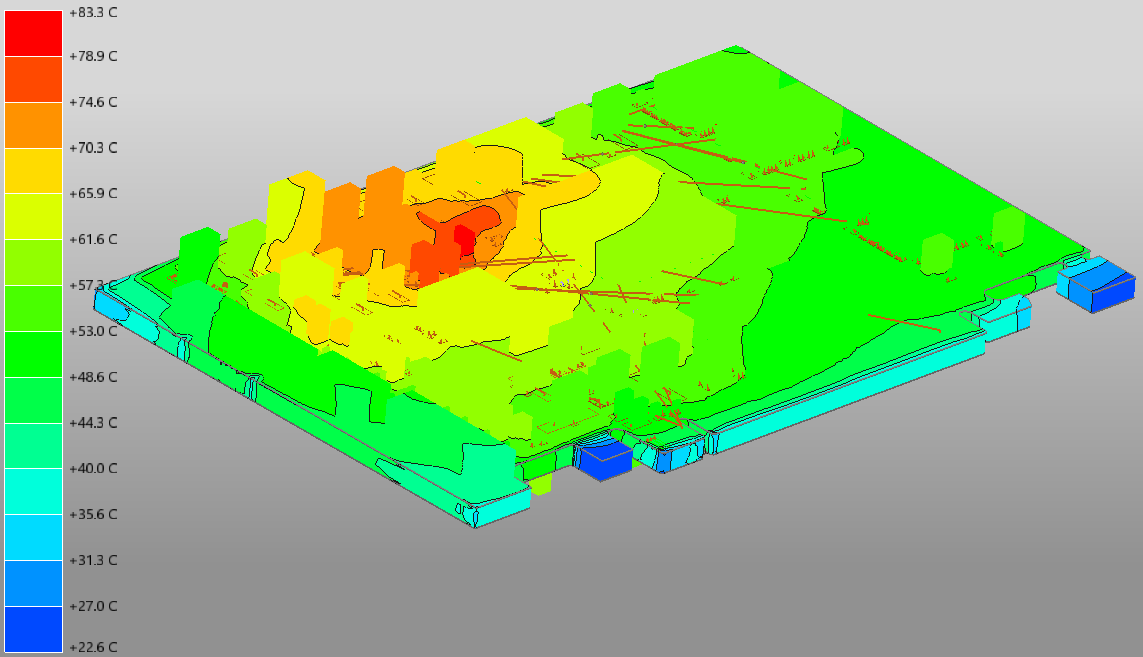
- Electronics cooling and thermal analysis covering a whole range from chip-level to system-level analysis and optimization. The plots below show the temperature (and in some case air flow) distribution for various systems and setups including: microchips, heat sinks, circuit boards, MEMS type micro pcbs, and a fan-cooled Li-ion battery pack subjected to solar radiation.


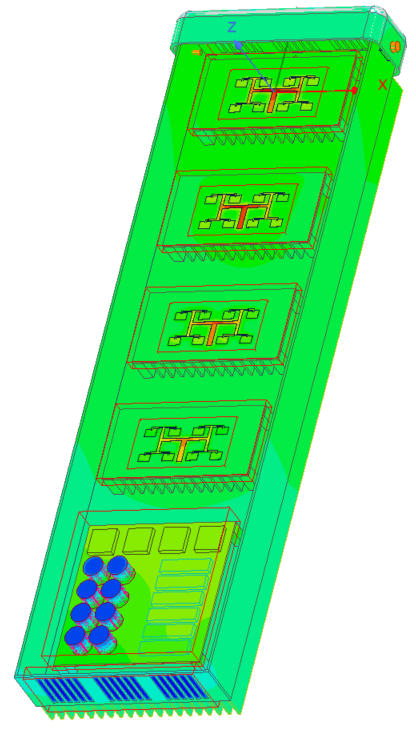
- Simultaneous multi-physics thermal and EM analysis is a must for modern day systems. As an example, a mm-wave 5G patch antenna is shown below. It has four arrays and eight elements per array operating at 28GHz with a total output of ~100W. Fins are used on the enclosure, and internally on the back of the antenna boards for thermal management. For this unit, EM loss is mapped from HFSS to Icepak, and the resulting spatially varying temperature is mapped back from Icepak for a full 2-way coupling. The steady state temperature distribution of the array shows a maximum temperature of 86C on the top array under electromagnetic (EM) loss, and natural convection. Compared to the uncoupled case, there is a 162MHz frequency shift in return loss for the base array, and also up to 1.65 dB degradation in far-filed peak realized gain for the side lobes at 28GHz.


- Design of industrial parts and processes based on multi-objective thermal-mechanical optimization. Often times, design of the solid components and systems involves a great deal of fluids / thermal coupling. Here are some design examples that are optimized for thermal constraints.


- Wind farm: Below, the wind speed disturbance (from the mean free stream) is shown for a 3×2 wind turbine arrangement. The dark blue is higher speed (by +0.2m/s), and white is lower speed (by -0.2 m/s). The disturbance is increasing, due to wake effect, as the air moves downstream.

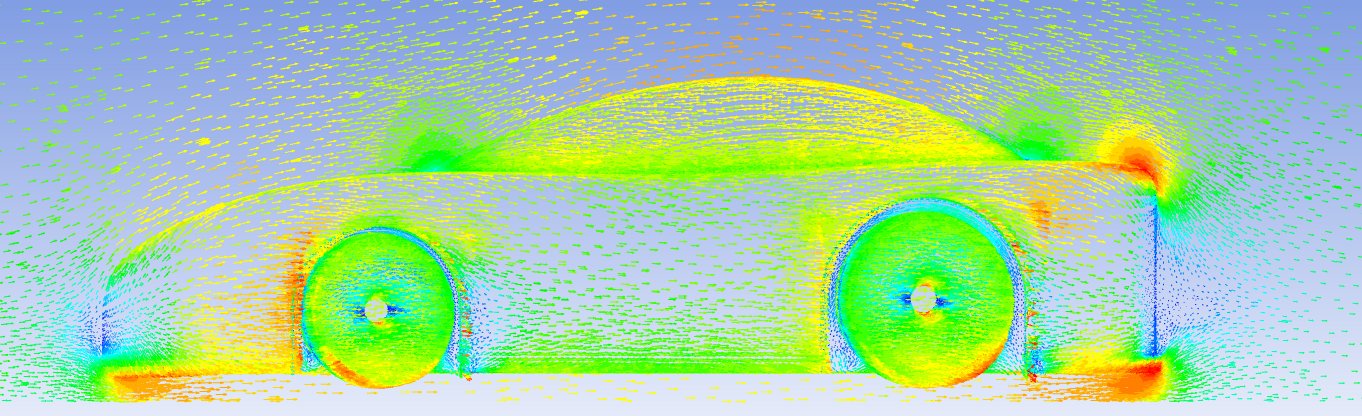
- Vehicle aerodynamics: The automotive aerodynamics is a whole different story — as opposed to flight aerodynamics — since the flow regime is completely different between the two. I have had the chance to look at various auto body shapes and configurations in the past. Below are some simplistic simulations that greatly help in design of the vehicles. For instance, the top panel below is the distribution of static pressure on the body middle plane (blue is low and red is high values) for a car traveling at 65 miles/hr. And, the lower panel is the air speed distribution around the same vehicle.

- Mud / bug traces on your car? Ever wondered why you get the sort of mud traces that you see on your car? Or why that kind of a particular trailing line of a poor fly or bug that hits your windshield / bumper? Well, here is the pathlines of air motion on the surface of a car that hopefully can help you answer the bug/mud question 🙂

- Nozzle / jet: This plot shows the time-mean velocity distribution in a subsonic jet simulated using LES.

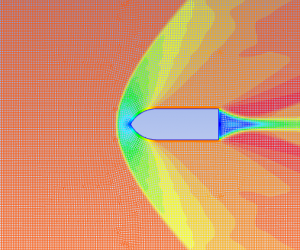
- Projectile aerodynamics: This plot shows the velocity distribution around a sharp-nosed body traveling at M=2.05. A strong curved shockwave forms in front of the elliptic flow region behind which Mach drops drastically. This is just an educational analysis to show the impact of the sharp-nosed geometry as opposed to blunt-nosed geometry on the frontal shock (notice the low Mach on the nose).
- Subsonic flight: This UAV is iterated for a minimal aerodynamic signature at cruising speed (dynamic pressure on the left, and velocity profiles on the right).


- Legacy — flow around a cylinder: Velocity vectors at Re=38,

and the time evolution of the velocity field at Re~100 until the Von Karman street is established: