Mapping Forces and Unearthing Theories, Hypotheses (and Insights) (Part 2 of project 2) Revised and Updated

Please read part one of this post here:

Project 2: The Samosa and the Gym

Part two:

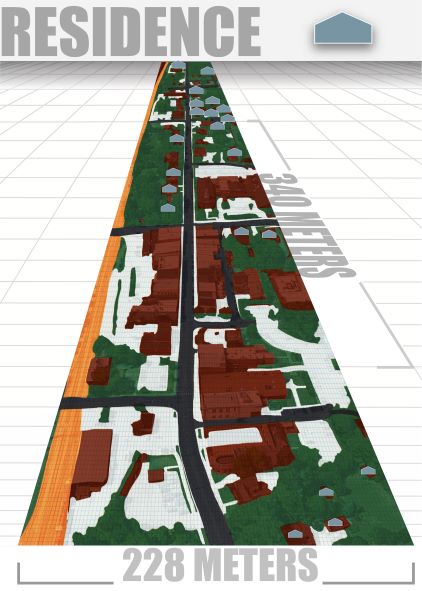
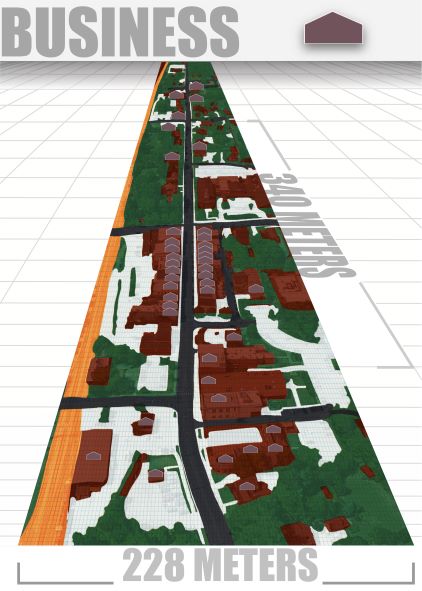
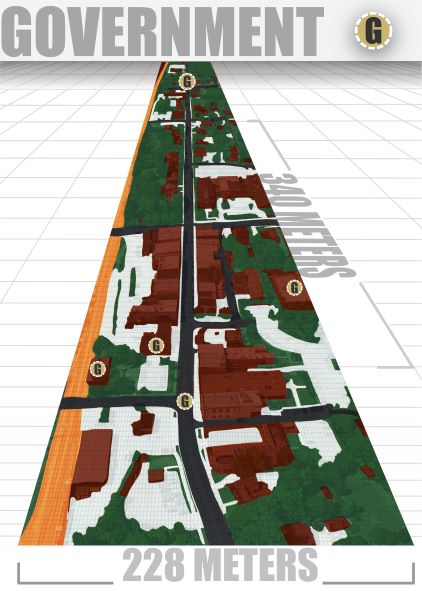
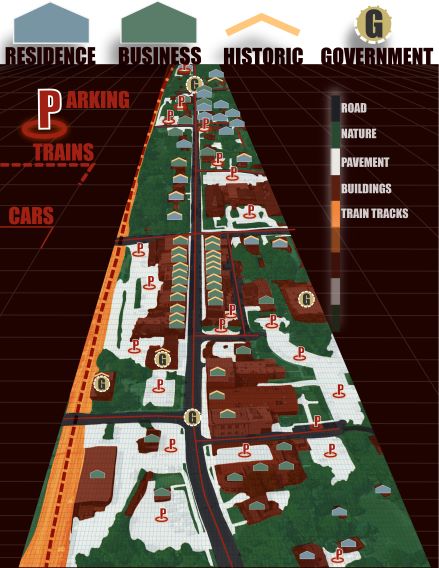
I took time to understand this project. Not just that, as I started doing it, I wondered “why we are even doing this?” I was learning many new things in Illustrator, but I was hoping to get more out of my project than that. Still, I did it anyway. I went out, identified the forces, took photographs, and recorded some videos about what I was thinking as I identified various forces. Here are forces that I identified:

Traffic (no words!)

Formal communication (mainly road signs)

Ethnicities (mainly Churches)

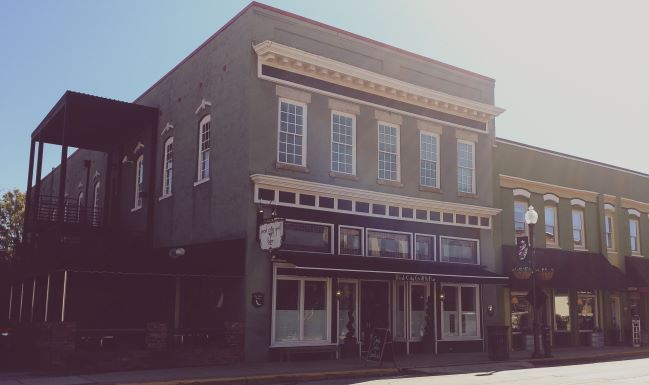
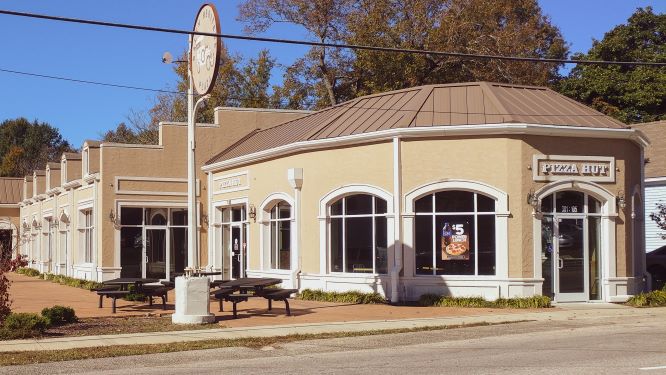
Businesses (small and medium sized)

Transformations (mainly new construction)

Cars (so many of them)

Trash

Traces of various kinds (but mainly un-recycled trash)

Forgotten things (public utilities in disrepair)

Wilderness (also rare in LA)

Informal communication (Mainly graffiti which is somewhat like ‘user generated content,’ where users = city dwellers)

Once I had the forces identified, I sat down and started plotting them into my base map. This took me a long time to do (I’m still finding my way around Illustrator), but I enjoyed the process and each successive layer became easier to make.

As satisfying as all of this was, it was nothing in comparison to what I started discovering was I plotted each subsequent force on the map. As I looked at my illustrator file, with the different forces stacked in different layers, it dawned upon me that there’s a way to compare and contrast various forces on the map.  I compared the forces mainly by looking at their ‘relative location’ to each other. This is when intriguing correlations started emerging. This opened my mind to new hypotheses and theories that I had not thought about thus far.

In hindsight, the layers function is also a great insight tool. It presents a unique view of an image and allows us to compare and contrast diverse bits of information. All this helps in analyzing an image in ways never imagined before.

The hypotheses I’ve gathered here might not be conclusive, given the limitations of this project’s scope and the relative atomity of my sample location in relation to the size of LA city. However, these theories and hypotheses can certainly be a basis for initial conversations about the way a city is organized and role of various forces in shaping a city’s character and destiny. This is big, considering the relative simplicity of things that I did, like taking photos and videos with my smartphone and processing them in Adobe. There’s a lot that we can do with the software tools available to all of us now!

Note:

  1. This exercise is a great way for city planners to generate hypothesis about what’s going on the in the city and then use data to check the initial hypothesis. I can easily see summer interns/volunteers doing such work with LA’s City administration.
  2. I visited my site twice to make sure my notes about the forces I identified were not conditioned by the time of day I noticed them.

Here are the key theories and hypotheses:

  1. Trash does not correlate with foot traffic:

I used to think that places with high foot traffic might have more trash in the street. However, what I discovered is just the opposite of this. Could it be that trash that is seen or reported by pedestrians is the trash that gets removed? At a broader level, are cities with more foot traffic cleaner than cities with few pedestrians?

2. Wilderness has been shrunk into a shrinking river

The only wilderness that I noticed was in and around the LA river. Because everything else has been turned into commercial or residential space, river is the only space that is left out of the scope of ‘development’. As a result, nature is trying to find its way back inside and around the river. This also prompted me to research LA river, and I leant much about its unfortunate past. First the city chipped away at its flood plains, and then many people lost their lives in the floods during 1930s. Soon after the river was transformed from a naturally flowing stream of water into a straitjacketed canal for flood control. Many species of wildlife were lost in the process. Now, the city is trying to bring all that back. They are trying to bring ‘Angelinos’ closer to the river by revitalizing it and promoting wildlife through various river revitalization projects.

More about this here:

https://www.youtube.com/results?search_query=history+of+la+river

and here:

https://www.youtube.com/results?search_query=la+river

3. Business correlates with traffic

Traffic congestion correlates with businesses of all kinds. These could be restaurants, small and medium sized offices or storage units.

4. Traffic correlates with formal communication

The more the intensity of traffic, the more the number of traffic signs. Does this mean that people tend to not follow traffic rules when they have more traffic to navigate? Does that mean we behave as less than ideal citizens and city-dwellers when we have lesser room to ourselves? Does that also mean we are ‘less civilized’ when we are pushed into a corner? Coming from India, with very high density of population, I see a parallel here. We tend to behave sub-optimally when there are too many of us jammed into a limited space a.k.a. unlimited people and limited resources leads to (not so charming) competition.

5. Informal communication does not correlate with foot traffic (or foot traffic reports informal communication?)

Informal communication, like graffiti, is seen in places with no foot traffic. Does that mean that graffiti makers are just expressing themselves and not trying to send a message to anyone? Or could it mean that foot traffic reports public graffiti and it is removed?

6. Transformations don’t correlate with traffic (they create traffic?)

There’s a lot of new development both commercial and residential happening in this neighborhood. However it is not happening in places that already have traffic and congestion. Looks like city planners know how to avoid adding congestion to already congested streets/neighborhoods.

However, I wish I had data to show that new development leads to traffic over time. Because such data will help us in seeing that new development in less congested areas is not preventing congestion, it’s merely postponing it.

But more fundamental than all this is the topic of land use and the defining question of “how many people are too many people for a city to be still livable?”. In this day and age, and with all the data and information available to us, this should not be difficult to find. I’ve never lived in San Francisco or NYC but looking at LA (and having lived in Beijing, Mumbai and Delhi) I can say that every city should know their point of equilibrium. Any development beyond this point should explore options such as distributing the additional population load to other cities or developing newer cities. This is what a responsible and strategically minded city, state and federal administration should be doing to guarantee quality of life to all the people in a city. Growing economic activity and prosperity that does not adversely impact natural resources and the sustainability of various social, economic and environmental ecosystems is the only kind of growth that matters. In other words, economic considerations can have a holistic outlook by factoring in economic, social and environmental sustainability benchmarks. A megapolis like LA can lead by example.

7. No foot traffic = forgotten space? (or forgotten spaces don’t attract foot traffic?)

Places that have no foot traffic are seeing sidewalks not being developed. Or is it the other way around i.e. people are not choosing to walk because sidewalks are in a state of disrepair?

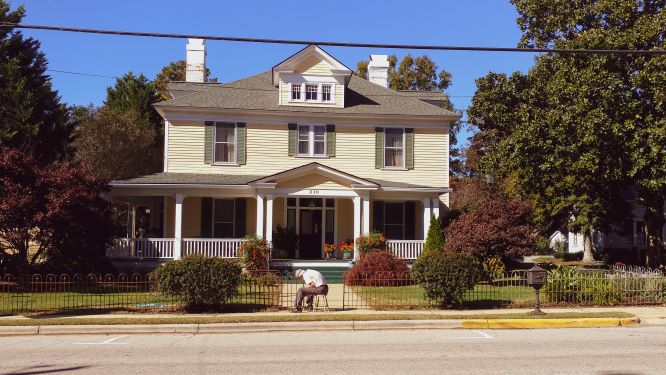
8. Housing correlates with ethnicity


Places of worship are smack in the middle of residential neighborhoods. Do neighborhoods need these Churches or do these Churches need these neighborhoods?

As I was thinking about all this, I could not help but draw comparisons with ‘Civilizations’ – a PC video game from many years back. In that game, we used to develop basic nomadic settlements, near a river or a lake, into giant megapolis. (This used to happen over time and after many wars with neighboring settlements). The game was modeled after the development of our civilization. Now that we know so much about where we’ve come from and how we’ve evolved into urban beings, can’t we do a better job of mapping our futures and build cities that are self-sustaining?

Appendix:

Forces and time

I also observed some of the forces at night. (Night = 11PM)

  1. Trash was less visible at night, thought I could see some of it
  2. There were more cars in the neighborhood (people had returned home from work?)
  3. Transformations were quiet and inactive and could barely be seen in the darkness (no lights at the construction site in the night. Just one big gate that was locked).
  4. Traffic was virtually non-existent. Far fewer cars on the road
  5. No foot traffic at all
  6. River was dark and I could not see any activity of any kind. I did hear some people talking by the river bank. (There are a few homeless people who come to the river at night).

Project 2 – Mappings: Sahar Abdizadeh

Irvine Spectrum Center

Irvine Spectrum Center is one of the most well-known shopping malls in orange county. Aside from shops, it has many attractions for families and children to have fun.

Force1:

(The Giant Wheel):
Irvine spectrum giant wheel is one of the iconic elements that can be viewed from the freeway. It’s design and lightings attracts people attention. There are beautiful photos of this shopping center with the image of the giant wheel at night on the shopping mall advertising photos.

Force2: Parking

 I believe one important element that can affect people’s visits to a shopping center is the availability of parking spaces. Irvine spectrum looks so overwhelming when there are traffic created due to many people anxiously looking for parking spaces.

Force3: Children’s Attraction 

One of the attractions of Irvine Spectrum Center is the Carousel. Most children love riding or watching this antique designed carousel. It affects the ambiance. Hearing kids laughing and having fun creates a satisfying mood for children and parents.
Another interesting attraction I observed was Luckey Climber. I really love the design of this climbing structure for kids. It is both safe, functional, and beautiful.

Force4: Music

One thing that I notice in this place is the ambient background music which is continuously playing in all the areas. I personally music, and I think one thing that makes me want to stay in this place longer is the music.

Force5: Cafes

This area of the shopping mall is full of family activities. I was not surprised to see 3 cafes with plenty to outdoor sitting areas for parents to chill out while their kids are playing

Final Map

PDF

Map Tracing – Tutorial

black & white map of UC Irvine campus, showing roads, buildings, and parks

Want to leverage Google Maps and Illustrator so you can spend less time tracing roads and more time adding qualitative features? In this tutorial, I’ll show you how to use Google Maps styles, Illustrator layers, and the image trace feature. The entire process took me 10 minutes, but if you’re new to Illustrator expect to spend around 30 minutes.

Step 1: Find your map!
We’re using Google Map styles for this tutorial 🙂

1. Go to mapstyle.withgoogle.com
2. Click “Create a Style”
3. Search for your location on the upper right, then zoom in to your desired size. DO NOT zoom in or out from this point forward!

map of UC Irvine campus

Step 2: Apply styles, take screenshots
Now we need to capture each type of feature (roads, buildings, etc) separately in black & white.

1. First up, roads! Click on the three vertical dots to the right of “Create map style” and click “Import JSON”. Paste this code and click IMPORT JSON
2. Take a screenshot of JUST the black and white parts of the map, without the sidebar or any of the “Google Maps” logo and info.
3. Now click the three dots again and paste this code for buildings. Don’t forget to take your screenshot! (If your buildings include residential houses, see note below.)
4. Repeat for parks, if applicable. Here’s the code
5. Repeat for water, if applicable. Here’s the code

NOTE: If your buildings are houses, they may not show up with the code I provided. I haven’t found a way to make houses high-contrast in map styles, so we’ll do it the old-fashioned way:

screenshot of adjusting the "levels" dialogue in Photoshop

1. Refresh the page, and zoom your map back into the spot/distance where you were before.
2. Adjust all three sliders at the top left to remove roads, landmarks, and labels.
3. Take a screenshot.
4.
Open the screenshot in Photoshop. Go to Image > Adjustments > Desaturate

5. Go to Image > Adjustments > Levels. Drag the left slider almost all the way to the right (until the houses are dark but the background is still visible) then drag the white slider to meet it. Save your file!


black & white map of UC Irvine campus, only showing roads
Screenshot of roads
black & white map of UC Irvine campus, only showing buildings
Screenshot of buildings
black & white map of UC Irvine campus, only showing parks
Screenshot of parks

Step 3: Bringing it all together!
Let’s set up your layers and import those screenshots.

1. Open Illustrator and create a new document. I chose Web > Minimum. You can always adjust your artboard size later. Be sure to save your file!
2. Name your first layer “roads”. (If you don’t see the Layers panel, go to Window > Layers.)
3. Drag and drop your Roads screenshot into Illustrator. Lock this layer by clicking the empty square to the left of the layer name. I like to lock any layers I’m not working with, to avoid accidentally altering the content in them.
4. Create a new layer, name it “buildings”. Drag and drop your Buildings screenshot into that layer.
5. Repeat for parks
6. Repeat for water

screenshot of Illustrator layers
What your layers should look like.

Step 4: Image trace
This is where the magic happens!

1. Hide every layer except “roads”. Unlock it.
2. Click on the screenshot to select it, then go to Object > Image Trace > Make and Expand
3. Do the same with your other layers
4. That’s it!! All of your map elements are now vector shapes. You can go into each layer to adjust colors, remove background areas, etc.

NOTE: You may need to adjust positioning of your layers. Refer back to a regular Google map to make sure that each layer is lined up correctly. Select-all on each layer (MAC: cmd+a, PC: ctrl+a) and nudge using the arrow keys.

black & white map of UC Irvine campus, showing roads, buildings, and parks
My map, with each layer color-coded.

Project 2 – Mappings: Robin Kang

WOODBURY TOWN CENTER (PREVIOUSLY ALL HANDS CAR WASH)

Woodbury Town Center is a community plaza surrounded by new residential developments in Irvine, CA. The plaza is owned by the Irvine Company and is a part of City of Irvine’s master building plan.  It is situated at the corner of a busy intersection between Irvine Blvd and Sand Canyon Ave.

Force 1: Traffic and Parking

The Woodbury Town Center has total of nine parking lots and seven entry points. The center’s major traffic flows from Irvine Blvd. side of entry point and Sand Canyon Ave. entry point. On weekends, parking lots by Ralphs, Trader Joe’s and restaurants are mostly full, making people park in other parking lots and walk towards Ralphs and Trader Joe’s.

Force 2: Locals

Woodbury Town Center attracts many local families.  There is a playground for kids in the center, near all the restaurants where children can play while parents socialize and watch the kids. I see many multigenerational families of kids, parents and grandparents in this part of the center.

Force 3: Water fountain

A large water fountain is located in front of LA Fitness, in between restaurants and the playground. The falling water sound creates tranquil atmosphere by blocking out busy noise from all around traffic.

Force 4: Variety of Restaurants

All the restaurants, except one- Fish District are located in one section of the plaza. From sandwich to sushi, a wide variety of available restaurants.

Force 5: Hidden Alleyway

I found a hidden alleyway next to LA Fitness by accident. As I was taking photos of the water fountain, I saw a small alleyway in the photo. In my exploration, I found amazon’s locker in the alleyway.

#6: Create a map of each of your five forces
Force 1 map: Traffic and Parking


Force 2 map: Locals


Force 3 map: Water Fountain


Force 4 map: Variety of Restaurants


Force 5 map: Hidden Alleyway


5 Forces Combined: Final Map


5 Forces Combined: Final Map Revised

After reviewing all comments and suggestions, I have made an update to my final map.  A legend is added as a quick reference guide to Woodbury Town Center.  Varying levels of color transparency represents high and low volume.  Also, the representation of people feels more natural in the final map revision. Download PDF

Project 2: Mappings | Renee Reid

The area in which I am focused on is considered midtown San Jose.  It’s a great area that I have chosen to live in, in part because of the forces below.

Transportation 

Transportation is a significant force in the area because it is a high commuter city since the majority of the residents work in the tech space in and around the Bay Area and there is also a large college close by, San Jose State University.  The below picture is one side of the San Jose Diridon Train Station. This major transportation hub includes buses, Amtrack, the  Altamont Corridor Express ( ACE) Train, the Cal Train, the major train line that goes up to San Francisco, and the VTA Line, which is a light rail that goes in and around cities in Silicon Valley. In addition, commuters can also access ride share scooters for their travels.

Parking 

Parking in and around this area can be very challenging because of all the different rules that change from block to block and street to street. Some areas require a permit others allow only parking on some days or for a certain amount of time. This can be extremely confusing and frustration for residences as well as people just coming to visit or shop in the area.


Stores and Restaurants 

The presence of restaurants and storefronts both small and large name brands throughout the area is a force that helps to influence the foot traffic all around the midtown area.  The restaurants and stores including a coffee shop, cleaners, a CVS and more allow for easy access which again influences the number of people walking in the area.

Wholes Foods, San Jose. Also includes a Brewery and outside seating area.
Local Coffe shop with outdoor seating area, next to cleaners and other storefronts.


Apartments 

Throughout midtown, new apartments are going up on what seems to be like every corner. These new dwellings all have businesses or office space available at the ground level which adds to the culture of the area. Businesses such as new restaurants and exercise studios are usually the first tenants in these mix dwelling apartments.

Modera the Alameda Apartments- Open Sep 2018
New Apartment Construction 1 block from Modera the Alameda Apartments.


Park and Green Space

There is a huge beautiful park and tall tree’s line all the streets which creates such a suburbia feel amongst the midtown hustle and bustle of people rushing to work, school and moving about.  People are often seen walking their dogs, playing frisbee or fetch with their dogs as well as flying kites with kids and children playing in the area under the watchful eyes of a parent or adult.

Cahill Park, San Jose


FORCES

PARKING
BUSINESS/STORE FRONTS
APARTMENTS
GREEN SPACE
TRANSPORTATION


Final Map

My final map included feedback from my peers which helped to present the force of Parking in a more precise representation. Instead of single cars that looked like traffic, I grouped the cars together to represent cars parked behind one another. This helped to open up the map more so that the other force Green Space on the streets could be emphasized better.


PRINT VERSION


Project 2 – Mapping: Annie Luong

I picked Pacific City mall in Huntington beach as my site because it is only 10 minutes from my house. The site is taken from the old name of Huntington beach city, which was an ocean front village. It sits across from the Huntington Beach pier and offers a mixture of restaurants, gym, coffee shops, and shopping stores.  

Force 1: Retail-tainment

As we can see the old type of malls, which only offer shopping stores like Macys, Jcpenny, are slowly dying and out of favor. There is a rise for a new future type of mall, called retail-tainment.


This new type of mall offers its guests with entertainment, shopping, and locals event options. Shoppers come here not only for shopping, but can also enjoy the food, spending time socializing with others while enjoying the amazing views of the beach. It is a whole new experience that people are rapidly embracing.


Force 2: Green building

The Pacific City mall is built as a green construction. This natural environment can be observed throughout their landscaping, to accent outdoor decor. Mixing between shopping stores and restaurants, there are beautiful green arrangments, wooden walkways with plant pots, give people the relax feeling while visiting.  Additionally, the usage of natural materials like wood is very prominent through the complex.


Force 3: Location

Sitting just across from the beach is a prime spot not a lot of places can beat this location. You can sit from the restaurant, enjoy the sunset while having your fish taco, or hanging outside drinking coffee, where there is plenty of outdoor furniture provided that help you relax and enjoy the scenery.


Force 4: Environmental awareness

The building has trash can everywhere, which also has fun signs to remind people to keep the place clean. They also offer priority parking for electric vehicles as an incentive. We can see how they embrace the environmental awareness.

Force 5: Local

Since the outdoor mall is in the beach city, we can see there is an influence of the ocean vibe everywhere, from the deco design to how the local dress up. From the photo, we can see the design of the lights was inspired by ocean waves.

The local people are all in relaxed, chill outfits, taking their time drining their coffee, enjoying the sights of nature.  

Final map:

Link PDF


Project 2: The Samosa and the Gym

The Samosa and the Gym

“Maps only reflect the reality, they don’t change it..”

But what is reality? Is it an objective truth? Is it the same for you, and me, and the other? Is it finite?

These are the questions that make this project interesting.

Initially I had some difficulty in understanding the brief, but I (think) I understand it now. We are learning to color ‘outside the utilitarian convention’ that has become the default setting of modern city and landscape planning and is characterized by single-minded focus on objects and functions. We are starting on this journey by reimagining maps.

My choice of environment represents my pursuit of a healthier life and the dynamic tension between two ideas that sit across each other, like two poles of a magnet. On one end is the samosa – a fried dish with a savory filling, such as spiced potatoes, onions, green peas, and sometimes lentils too. It is a three-dimensional triangle and is accompanied by chutney. It. Is. Very. Tasty.

Samosa

On the other end is my gym, a place where I go to shed those calories that my samosas bring to me. Over the past few months, I have had to walk the tight rope, forcing myself to eat fewer samosas and telling myself to go to the gym regularly. This tension makes these two places important. However, until today, I had not thought much about the space and things between these two places. Thank you for making me think about it.

The space between places and the unmapped cracks within this space.

Here’s a quick sketch of the space that I chose to map:

Am I really mapping the unmapped?

Even as I start to think about this space in a way that goes beyond the way contemporary normative maps represent it, I realize that there is a limitation in my thinking. It is the streets. The streets I’m traversing are predetermined. So, reinterpreting this space is limited by the fact that I’m walking down predetermined streets and walk-ways.

Like always, I’d also take this opportunity and contrast my experiences in a developed country like the US with its much-evolved urban infrastructure and matured rules of engaging with this infrastructure vs other developing countries which have limited to unstable urban infrastructure. The lack of infrastructure forces people to find ‘their own way.’ It’s not surprising that in developing countries like India, Cambodia and Vietnam and sometimes even in China mapping heavyweights like Google maps are not reliable. They are neither extensive nor updated. In these countries, we rely on landmarks like homes, temples, wells, intersections, shops, powerline transformers etc., and above all PEOPLE. All this much more than conventional road signs, printed or mobile maps.

Being comfortable without maps is a way of life. This is in sharp contrast to developed countries where people have grown up to expect nearly flawless urban infrastructure and city planning. Unless they are leaving the city and the suburban infrastructure and venturing into the wild, they have little need to worry about finding their way.

Am I really mapping the unmapped? (Video)

Coming back to the project brief, I chose not to look at any of the existing maps. However, as I got home and started downloading photos, I realized that although I was not looking at maps, maps were certainly looking at me : ) Here’s how they traced my path.

My photos + videos geo-tagged and layered on top of Apple Maps (MacOS and iOS)

Same layering in 3D

Immersive maps?

If only maps also documented sounds, smells and feelings they were representing (play video below)

What do firefighters see?

Different ways of seeing and observing. Like, wearing different thinking hats or seeing through different lenses.

On to some of the forces I observed in action

  1. Traffic

First we made cars, cars made traffic, and now traffic makes us : (

2. Automobiles:

They are everywhere

There are so many of them, that even when you are trying to take photos of other things, automobiles find a way to creep in

3. Transformations:

From a gas station

to

an apartment block


Other new construction

Such construction can be seen all around Silver lake. This neighborhood is developing fast.

4. Formal Communication: 

The many rules of engaging with traffic and adjoining public spaces. The more developed urban infrastructure is the more prescriptive are rules of engagement. This is something we do not see in less developed countries that do not have much in the name of a viable public infrastructure.

Don’t cross here

Don’t be in two minds now, must turn right

Don’t drink here

River looks nice, but don’t stop here

You might be paying taxes, but its not your land

Don’t walk here

Bikes go away

5. Waste:

One homeless man lives under this bridge during the day the to escape the sun and the heat. I wonder where does he go at night.

6. Wilderness and the River:

LA river, which hardly looks like a river, has some wild vegetation as it tries to reclaim its rightful place in the city. I did not know that LA had a river, but when I moved into this neighborhood, I started researching online and discovered some informative documentaries about the history of LA River. I was surprised to learn that it used to be a free-flowing river till it was decided that it has to be tamed and turned into a Bonzai version of itself.

Side note 1 – YouTube also has interesting videos describing Salton Sea. At one point, Colorado river used to flow into it was supposed to become a big tourist hub. Property was sold, resorts were built. But the river had other plans. I learnt about Salton Sea from  GTA5 – a video game which is set in a city called Los Santos (which is a rough copy of real world LA.

Side note 2 – GTA5 and GTA4 have detailed and editable maps.

7. Traces and Decay:

Product packaging in their afterlife. These random boxes seem to have managed to escape the cycle of life and death at the hands of the trashcan and the dump truck that comes looking for them every week.

I wonder how this car bumper managed to get here : )

8. Businesses

A business wearing its Indian ethnicity on its sleeve

Exotic businesses. This store has giant tropical parakeets

9. Ethnicity and Religion

Silver lake is at the edge of Glendale. The city has many immigrants mainly of Armenian descent. Ararat (the mountain range between Turkey and Armenia) is an important symbol in Armenian culture. Many Armenian businesses are named after Mount Ararat.

10. Forgotten:

Here’s a side walk that is disappearing, slowly. The soil that is sliding from the hillside is slowly encroaching on to the sidewalk. Looks like LA municipal authorities have forgotten about this sidewalk : )

11. Informal communication?

And lastly, some childhood memories. I used to think of billboards as landmarks on my way home. I used to get lost often : )

What does all this mean? Is there a correlation between forces? What does correlation (or the lack of it) mean? Continue reading here:

here https://sites.uci.edu/in4matx282f18/mapping-forces-and-unearthing-theories-hypotheses-and-insights-part-2-of-project-2/


Project 2 – Mappings – Ken Mead

Mappings: Green Lake, Seattle

Final Map

November 20, 2018

View PDF

For the final version of the map, I incorporated feedback from the previous iteration to strengthen the communication of the forces at play. I simplified the movement into walking and running, and added the dimension of most-frequented paths. The noise level was illustrated over a threshold so only the loudest areas were represented. I also represented these as circles that radiate outward from the center, as sound travels in the real world. Trees are separated from grass and shrubbery. Finally, the entire map was vectorized which simplified the image and communicated the forces more directly.

If I took this map myself, I might use it if I wanted to know popular running routes along the lake or be compelled to investigate areas where the noise level is high. There is probably a lot of activity there. Or perhaps I’d want peace and solitude and go where the noise level is low. I’d know to look at the popular photo spots for scenic views.

Part 3: Combined Map

Version: Nov 13, 2018

map of green lake in Seattle showing forces like noise, photographers and traffic

Part 2: Five Forces, Five Maps

Force 1: Tree Cover and Shade

Force 2: Noise Level

Force 3: Amateur Photographers

Force 4: Foot Traffic

Force 5: People Sitting  

Part 1: Description of Five Forces

Force 1:  Noisiness vs solitude

One of the things that makes Green Lake a great park is the diversity of activities that happen there. I noticed the sounds change a lot depending on where you’re placed in the park. If you’re near the playground, there are the excited yelps of kids. Standing near the tennis courte you hear the thwop of the tennis ball being hit back and forth. Other parts of the park are more serene with the lake water gently lapping at the lake and the ducks calling over the water.

children running and playing in a field

trees lining a lake

Force 2: Wheel-based mobility (vs feet)

During my observation I saw the following types of transportation around Green Lake: walking, driving, rollerblading, skateboarding (both manual and electric), biking, and pushing baby buggies.

person jogging and person biking

a sign marking feet vs wheels

Force 3: Cellphone Photographers

Every time I am at Green Lake I always witness amateur photographers taking photos. Usually it’s of the lake. It would be interesting to map which areas photographers are naturally drawn to. One of my observations I found a lady stooped over some mushrooms on the ground.

a man taking photos of a lake

lady taking a photo of mushrooms

Force 4: Open vs Canopied Spaces

The multitude of trees is a prominent feature of Green Lake Park. The density and placement of the trees naturally creates some spaces that are covered in a canopy of trees, whereas other places—the sports field for example—are wide open.

a soccer field

tree lined park

Force 5: Sedentary vs Active

The many benches around Green Lake offered people an opportunity to sit and be still. But it wasn’t just the benches where people decided to sit. The sports field had people running around as part of a soccer game, but also had people sitting quietly on a blanket.

man sitting down feeding a goose

woman running on gravel path

Mappings: Kathlyn Cabrera

Final Revision:

Mappings Kathlyn
Click image to view PDF

I gathered more feedback both on the design and the message behind the map from classmates and friends (thanks everyone!), which led to these adjustments. I added the alleys force back in, I added parking lot areas in the Wheels category, and I made the buildings colors stand out more. I also added the sun position at a specific time of day (1:00pm, during my lunch hour, which is when I’ve typically observed this area) to show where the building shadows are coming from.


Part 3:

Mappings-Part3-Kathlyn
Click image to view PDF

Based on the feedback I received so far, I chose to limit my site to a specific perimeter in this area to help focus my map. I then expanded upon two of my forces: tall buildings and traffic. I gathered detailed images of the buildings in my site and chose to distinguish between low-rise buildings (less than 10 stories) and skyscrapers. Jesse made a fun suggestion during office hours that I’ve played around with – that is to add shadows to the tall buildings/skyscrapers to further emphasize their towering presence in this area. I also broke down the traffic force between wheels and feet/paws to give a better sense of the flow in this area. (I was going to title them vehicles and pedestrians/pets but wheels and feet/paws sounds more fun, and encompasses a few non-vehicle wheeled transportation such as bicycles and scooters.) I did not include alleys and landscape architecture, because these are overlayed with the wheels and feet/paws information that it might be too much information on top of each other. I also chose not to include pop-ups because most of the pop-ups I know of were not located inside the perimeter I chose, and to be honest, I don’t even know how to begin mapping information that is reliant on time.

I’d love to hear any feedback! The changes on this were pretty drastic between parts 2 and 3, and I am open to even more feedback to iterate on. Thanks in advance!


Parts 1 & 2:

San Francisco north Financial DistrictThe site I chose is in San Francisco’s north Financial District area. For those of you who know SF, this area is closer to North Beach than Market St. and I chose it because it is close to where I work. I enjoy its relatively quiet atmosphere, away from the bustle of “actual” Financial District which is closer to Market. I like that there is no name for this neighborhood that I’m aware of, and it feels like an in-between place (between FiDi and North Beach) with a culture of its own.

My center is the green area, a park called Sydney G. Walton Square which is across from my office, where I walk by every day and occasionally sit to enjoy my lunch outdoors.

Force 1: Tall Buildings

Force 1, Tall Buildings

Force 1, Tall Buildings

The Transamerica Pyramid is the second tallest skyscraper in SF, and it sits in the periphery of my site area. Also in my site area are other tall structures, mixed-use commercial and residential buildings. The height of these structures are literal forces that jut out of the ground up into the sky.

Force 1: Buildings


Force 2: Hidden Alleys

Force 2: Hidden AlleysIf the tall buildings are like mountains, these hidden alleys in SF are like valleys. They are unexpected and oftentimes quaint in this upscale SF neighborhood. To me, they feel like hidden coves waiting to be explored.

Force 2: Alleys


Force 3: Traffic

Force 3: TrafficForce 3: TrafficDelivery trucks, food trucks, personal vehicles, share-riding vehicles, bicycles, scooters, skateboards, feet, paws – the list goes on. The pathways in my site area get quite a bit of traffic. SF is still a big city, and this is still the Financial District after all, however quaint and quiet this neighborhood can feel at times.

Force 3: Traffic


Force 4: Landscape Architecture

Force 4: Landscape ArchitectureNature in a city is usually carefully planned by landscape architects, and my site area is no exception. The “center” I chose is a park that was definitely planned – one obvious example is that it has walkways that lead to the surrounding office buildings. Most of the streets in this area are tree-lined and some of the brick buildings have vines covering their façade. The nature here is the way the humans in this area designed it to be.

Force 4: Landscapes


Force 5: Pop-ups

Force 5: Pop-upsForce 5: Pop-ups

Off The Grid hosts food trucks on Vallejo and Front St. every Monday, Wednesday and Friday for the office lunch crowd. These food trucks come and go – they are temporary by nature. In the parking lot next to these trucks, there is currently construction rapidly happening for what looks like another pop-up building. A month ago, there was a pop-up in this same parking lot advertising Audi’s new electric car release. Pop-ups generate excitement because of their temporary nature, but in their wake is just a parking lot or an empty street corner.

Force 5: Pop-ups


Project 2 – Omar Filippelli

Palladio Mall:

The perfect place to shop, dine, and play. Spending time in this open mall is a delight. I happen to work at the offices situated here so, taking regular breaks is very appealing. Going for walks, getting a frozen yogurt, eating lunch in the restaurants and or if time allows watching a full feature movie release. These are some of the activities one can find at any time of the day.

Now the whole site is getting ready for the lighting the Christmas tree event. Other forces include:

offices: Palladio offers three full floors of office space to lawyers, builders, software developers, and other technology companies who occupy the space.

corridors: Pleasant and large corridors connect every corner of the open mall with a grace of modern architectural structures, and beautiful garden designs. These provide an inviting way into a consistent outdoor experience even into forgotten or less used corners of the site.

vacancy: The way unused space is utilized prevents visitors from feeling that the mall is empty. It always looks busy and inviting. Full color murals cover the vacant spaces, as seeing on the end of this passage below. Adding to the fashion exterior design of the area and contributing to an environment of high-end shopping experience.

vegetation: The vegetation is a traditional California feel with palms guiding the main roads of the mall and plenty of shrubbery and seasonal flowers accompanying visitors anywhere they go.

festivals: Palladio offers a variety of festivals and activities for local families and youth. These include rock and roll concerts, singers, aerobic classes, yoga in the park, and many other local activities.

water flow: Well placed water fountains continue the outdoor design theme by adding a touch of raw nature, sound, and an oasis-like relaxing feel to the visitor seating or walking throughout the venue.

vehicle parking: Palladio mall is designed with parking places on every internal street plus two parking buildings with two and three floors respectively.

Part 2 #6

Main Map.

offices force:

corridors force: 

vacancy force: 

vegetation force: 

festivals force: 

water flow force: 

vehicle parking force: 

Final Map First Attempt

I was not happy about my first effort in trying to combine these forces, it seemed a bit bland and boring. I wanted to differentiate my selected forces from the rest of the map elements, looking for a more drastic differentiation between them. One positive feedback I received about the organic way in which I’ve depicted the vegetation force, inspired me to look for a way to represent some of the other forces in a similar way.

Final Map

All 7 forces combined. I made several changes based on feedback from peers and meeting with Jesse on Monday. Rotated the map to better use available space. I also moved away from simply showing a block of color to represent a force. Added a level of simplicity and sophistication by reversing the color of the background image. And I was able to highlight more effectively the concentration of human traffic in the different areas of the mall. One can easily see the areas of greater human concentration loads and traffic within corridors, streets, and parking areas.

Final Final Map

Changes made after receiving feedback from my cohorts.

Link to PDF

Project 2: Lisa Grossi

Redondo Beach Pier

Redondo Beach Pier

Located several miles south of LAX, the Redondo Beach Pier, located in Redondo Beach, CA, offers dining, shopping, and entertainment. The pier is popular with locals and tourists alike and has a long history with sports fishing.

Restaurants

The Redondo Beach Pier features many restaurants. Fishing boats bring freshly caught seafood to the restaurants each morning, making the pier a great place to sample some of Southern California’s best seafood.


Bicycling

Los Angeles’ Marvin Braude Bike Trail runs over 20 miles of Los Angeles’ scenic coast and runs directly through the Redondo Pier near the southern end of its route. Any day of the week, the bike path is busy with traffic. Whether riding through or taking a stop, the pier is one of the many notable destinations on its route.


Parking

Unlike several other popular piers along the Los Angeles coast, the Redondo Beach Pier offers ample parking. There are several parking garages located directly behind the pier as well as several parking lots with metered parking a short stroll away. If you’ve stayed at the pier longer than planned, have no fear, if you parked in one of the garages you can extend your parking permit through text.


Seating

No matter where you are at the pier, public seating is within sight. Public benches and tables are along all of the pathways. Even on the busiest weekends, benches remain available.


Recreational Activities

At the Redondo Beach Pier, there are ample recreational activities to choose from. The pier is popular among local fishermen and has a cleaning station located at the end of the pier. Sailboats sail from the Pier’s marina daily; boats and boat tours can be rented from the same marina. The pier’s protected waters are a popular place to paddleboard and on the other side of the pier, surfers can be seen regularly hitting the waves.


Combined Forces

Larger PDF version

Project 2: Greg Puett

My chosen location

The Desert Ridge Marketplace


Climate
In phoenix, where the summers peak at over 110 degrees, (record high 122) dealing with the heat is vital. You either have two options, make your property be entirely indoors, or build intelligently to take advantage of landscaping and shade. Desert ridge is built using shade and intelligently aligning the buildings to minimize sunlight on customers, using an east-west corridor, where most shops have either a north facing door, or a south facing one that is always shaded.

Income
This marketplace is a fairly popular shopping hub for people in Northern Phoenix, and even attracts customers from the more affluent areas of Cave Creek and Scottsdale. The socioeconomic status of the surrounding areas is a primary force at play for this location. You can see this in the wide variety of shops available here, from a Kohl’s and Ross on the outside of the market, to a chocolate shop selling 20 dollar chocolate apples, or a Korean BBQ restaurant selling Wagyu steaks. 

Culture
Desert ridge provides a community stage for various performing arts groups to come and put on shows during business hours. These usually draw large crowds and drive business to the shops.

(Note, I don’t really like how poorly this maps, if you have suggestions, i’d love to hear them, otherwise I’ll probably change this force.)

Tourism
Immediately next to the marketplace is a Marriott Resort and Spa, complete with Golf Course, Tennis courts, pool, even a lazy river. This being so close to the Desert Ridge Marketplace also drives a great deal of business and visitors. Additionally, due to the price of the resort, this adds to the income forces at play here in the marketplace.

Business Types
The marketplace is also built and oriented in an interesting pattern, where the larger department style stores are on the exterior, in their own rows across a parking lot from the main marketplace, while the smaller or more specific shops are within the marketplace itself. While you cant see the names from this satellite map, you can see the general layout.


Final* Map

This map will be getting updated every day (probably) So come back frequently with advice/suggestions. Feel free to add to or suggest changes to my list of planned changes below.

Planned changes include

  • Renaming shops from “places” to “Stores/Restaurants” – Please provide you suggestions here, I don’t like the / but cant think of a better word for “places you spend your money”
  • Adjusting the base map a little to the south west so that the intersection in the north west is more obviously an intersection
  • Including a compass, I’ve always loved those.
  • Maybe adding the shops “value” back in as people suggested for my income map. Removed it because it felt off on the full map.
  • Finding a way to categorize something as both a tourist spot, and assign a “place you know” value to it.
  • Figuring out how to clearly indicate where the tourism is primarily coming from.
  • Maybe modifying the sun path to more clearly indicate sunlight, or eliminating it entirely.
  • Double checking all the stores, the vacancies are based on memory, not accurate details, I’ll go back on Saturday and make sure it is all correct.
  • Also apparently I need a scale.

Underlined and Italicized = complete
Strike = Did not implement

Final Final Map

Mappings: Graham Bachelder

    Forces: The Irvine Spectrum

 Download the full-sized PDF of all five forces here.


Nature

One of the first things you might notice from this site is its use of nature in numerous ways. Towering palm trees, lush grass patches, bubbling water features, and the open sky are all part-and-parcel with the caramel stucco and crimson terracotta shingles that make up every building. This is fairly common in the Golden State, but the Irvine Spectrum takes outdoor living to another level by inviting its crowds to lounge outside in its cool breezeways and shaded plazas.


Commerce

Commerce is the life-blood of the Spectrum, the force through which it thrives and nourishes itself. Trendy clothing shops, enormous retailers, mouth-watering dining, state-of-the-art tech – you name it, and the Spectrum’s got it. Any variety of retail needs may be met by a visit to this site, and its circular layout and various stalls subtly entice one to continue just a bit further down the way until they are swept up into another shop, mesmerized by a display in each store’s giant floor-to-ceiling windows.


Entertainment

Not feeling the need for retail therapy? Then you’ve still come to the right place! Night transforms this place into a vivid playground for both kids and adults alike, with venues and fun for all. Comedy clubs, concert stages, arcades, cinema, and even a massive Ferris wheel are all contained within the Spectrum’s grasp.


Location

Nestled perfectly between the merging 5 and 405 freeways, the Spectrum is poised right in the heart of Irvine, California. Not only is this location extremely accessible, but it’s poised right in the middle of Irvine, California, one of the state’s most populated cities. Further, the Spectrum is surrounded by innumerable businesses, both large and small, which, like clockwork, spill into it’s walkways and businesses every day for lunch, meetings, or just a short break from the office.


People

Without patrons, this site would become a ghost-town. Luckily for the spectrum, there is no shortage of life, however. Local schools, businesses, and neighborhoods supply a seemingly endless flow of traffic in and out of the center, at all times of day. Weekends bring families in need of shopping and some time out of the house. Nights see dates and hangouts happening throughout the center. Mornings and lunch are inundated with nearby employees searching for a quick cup of coffee and a bite to eat.

Project 2: Cindy Wang

I chose to visit a tiny, gentrifying area of Carson, with Greendoor Coffeeshop as the anchor location in the midst of it all. Nearby is the Carson City Hall, with the Carson Community Center not too far away. Just half a mile away is the exit/entrance for Highway 405, which is the major center north/south in Southern California. In the immediate area, there is an IHOP, a restaurant called DogHaus, a residential area called the Renaissance at City Center, an upscale apartment complex.

While exploring, the following five forces came to mind:

  1. Traffic


    With the major 405 highway just half a mile away, and the anchor location at the corner of a four-way intersection at East Carson Street and South Avalon Boulevard, traffic is a major force here that adds to the energy and vibrance of the area.
  2. Lush
    In the immediate area, there is a large water fountain, palm trees, vegetation, a Greendoor coffeeshop, vines, and shrubs. There is a lushness to the little area. 
  3. Growth

    The area is currently being gentrified – about ¼ a mile away is a strip mall with pawn shops, a few takeout, and lavanderia (laundry shop), and next to it seems like new apartment complexes across a mix of chain restaurants and a Ralph’s. 
  4. Residence


    The area is considered “city center”, and there are apartments being built around the city hall and community center.
  5. Newness

The city of Carson is the youngest municipality in the South Bay area of Los Angeles. The apartments, the little gentrified area with the Greendoor anchor, the city hall, and the community center are all relatively new. The businesses below the apartment complex have only existed for about a year or less.

Part 6

Force 1 Map: Traffic

Force 2 Map: Lush

Force 3 Map: Growth

Force 4 Map: Residence

Force 5 Map: Newness

Nov. 13th Edit:


larger 24” file here.


Nov. 20th edit:


Larger map here.

Ok so explanation here – I was very unhappy with my Nov. 13th map – it felt uninspired, as Serena said I didn’t really have an audience, it barely shows forces. I also had to consolidate a few of my forces, which I felt like left me with nothing. So I decided to do a 3d version of a “map” with a bit of an artistic interpretation (I’m hoping that this is ok).

My attempt to illustrate my 5 forces:
1) residences are the little grey buildings with windows on them, surrounded by man-made trees.
2) the element of lushness are the foliage and trees.
3) traffic manifests itself with a ‘traffic-over-time’ illustration, showing what the car buildup looks like from the afternoon to end of the working day.
4) the 50% opacity buildings on the top left corner are growth & development, and the lowered opacity is meant to show that it’s not there yet, but that’s what it would look like on the map.
5) the last force is a little hard to see, but it depicts chillness. It’s the gradient circle at 50% opacity, fading into transparency. It’s over the Greendoor coffee shop, as well as the leisurely pool inside the residence. The reason why I chose to represent it this way is because chillness is an ambient force that’s pervasive over an area, and the soft gradient and fade is what comes to mind when I think about a relaxed ambience.

*I haven’t used Illustrator in a billion years and certainly have never done isometry before, so bear with me that it’s rough, but I learned a lot. I definitely had a hard time layering and re-sizing in 3D, it was honestly a nightmare. You can tell my learning curve through my trees – I started off with blocky trees, then got circle trees, then learned how to do oval-ish trees. I liked the diversity in foliage, so I left it there even though it’s not particularly accurate since the lushness I was referring to weren’t topiaries.

Project 2: Alexa Steinhauser

SITE

The site that I am observing for this project is located in Santa Monica, California. More specifically, the cross streets are Lincoln Boulevard and Broadway. There are numerous businesses, housing complexes and construction taking place on any given day, and the diversity of people is infinite. There are tourists coming from out of country, but also residents from down the street that populate the area and make it thrive. There is a historical Quonset hut from WWII that has been turned into a burger joint.

TRAFFIC + TRANSPORTATION

Broadway has one lane per way, and is the street that goes directly towards the Third Street Promenade. There are tons of meters, parking structures, biking lanes, and cars that occupy the area. I would say that Santa Monica is one of the most bike-friendly cities in the Los Angeles area because of the dedicated lanes. There is also the Metro light rail that connects Santa Monica with DTLA and other major areas.

RESTAURANTS + SHOPPING

Standing at the intersection, there are more than fifteen businesses in view. From restaurants, to grocery stores, to deli shops, to coffee shops, there is a lot of activity from residents and people who work in the area. There is also a museum and public library in walking distance, which attracts people of all ages.

VEGETATION , RECREATION AREAS + PARKS

There are at least three parks within a couple blocks in which people play basketball, soccer or just relax. The beach is also within ten blocks west which attracts people of all backgrounds. You’ll find bikers, volleyball players and performers looking for activities to be a part of. Tongva Park, which is adjacent from the Santa Monica Pier, has an overlook bridge in which you can capture images of the ocean, skateboard, or take part in an acroyoga group twice a week. The pier is somewhat of a small amusement park full of games and rollercoaster rides.

HISTORY + MUSEUMS

As mentioned previously, there are landmarks from WWII as well as other historical landmarks. There is the Santa Monica History Museum, located within the public library, and the Santa Monica Pier Museum located off of the famous pier and visitor’s center.

FORCE MAPS

Force 1: Restaurants


Force 2: Parks


Force 3: Public Transportation


Force 4: Entertainment


Force 5: Art & History


Final Map:

Project 2: Mappings, Rui Lin Zhang

Updated synthetic map based on the feedback

I updated my synthetic map based on the various feedback I have received. I think those critiques helped reshape my map to be more clear and self-explanatory.

Part 3, The synthetic map

I decided to take a different approach for the synthetic map after reading the critiques I received, and they all are very solid suggestions. I want to expose more of the forces in the map because I feel my outlines of the forces in the individual maps do not stand out as much. Since there is a learning curve for me, I decided to keep it that way and not to change my individual maps but to reflect the changes I want to make in my final piece. I want to especially thank Greg for pointing out a few things to help me improve my map for force 4, the fest. I feel I have improved it significantly because of his great critiques.

The PDF for Project 2Mappings

Part 1, Observations
Bring Design to Life: The CAMP of Costa Mesa

The CAMP is located next to South Coast Metro, the heart of City Costa Mesa.  This place has been described a green, eco-friendly retail campus dedicated to an active, healthy lifestyle mindful of environmentalism and supportive of the local community.

Force One: The Ambiance

The architecture of the site is mimicking the atmosphere of a campsite. The floor design of the site does not simulate a typical layout of many shopping centers.The entire place has shown the wildness from the ground up, and definitely lives up to its name “The CAMP” . There are always streams of traffic flow through the site with great dynamics and energy. Even if someone is just looking for a place to kick it and relax, this would be an ideal place to come and enjoy the atmosphere of a nice blend of the urban and the nature.

Force Two: The Culture

The CAMP balances culture, sophistication, and functionality, blurring the boundaries between nature and everyday bustle of life in Orange County.  It’s a place for whoever likes a spot with lots of photo ops, hipster stores, and might be overpriced but strictly organic food. If you are seeking to find your inner hipster, this is the place cannot be missed. It’s not the biggest place to walk around, but the uniqueness of the shops and outdoor areas are enough to keep you entertained with friends. Random resting areas are placed in every corner, Plenty of hammocks, tables, greenery are built on the site.

Force Three:  The eats, spirits and hangouts

The CAMP has great selections of restaurants. There are wide variety of food and drinks for everyone. Whether you are a steak lover or a strict vegan or on a diet or not dieting, there is always something for you. From the famous Umami Burger to a healthy all natural vegan burger, or the mouth-watering tacos from Taco Asylum’s it’s hard to walk away with disappointments. The site also has several gourmet coffee shops, such as milk+honey to challenge your taste buds for coffees.  If you are a wine lover you also come to the right place. There are wine tasting spots such as WineLab for the wine enthusiasts, where people could discover and learn about wines while having a good time with friends.

Shopping at CAMP can be a lot of fun. So many cute little shops settled in on the site. Some of the merchandise may not be the best bargain, but definitely one of a kind. A lot of the stuff sell in the shops are oddly attractive, and super interesting. It’s fun to just look round in those shops.

Force Four:  The Fest

Throughout the year, The CAMP also hosts events, art shows, and exhibits to bring the community together. In fact, the site received great reviews for being one of the best venues for hosting shows and events in Orange County. The entire place has a very hip organic vibe. The site brings in a very conscious crowd, and creates great cultural dynamics.

Force Five: The amenities

Due to its high popularity, the parking in this place can be a real challenge. I have never found a time there was enough parking when I was there. The site reserves spots for valet, which is never a preference of mine when I visit places. The CAMP does offer free valet with validation. You can get it validated at any restaurant by handing over your receipt. Tips for valet are not required but definitely encouraged.

Part 2, The maps of five forces 


Project 2: Christine Benedict

I chose Balboa Park as the area for this project. It is literally right across the street from my home and is a huge part of the city center in San Diego.

Google map showing the location of Balboa Park within the city
See that square of green in the middle of the city? That’s the Park!

One of the first things you will notice is it is massive and includes a lot of different things within it. It has many museums, activity areas, the Navy medical center and also the San Diego Zoo!  I narrowed my area of focus to the central section of the park as that is more easily walkable.

Combined map showing music, vegetation, tourists and forgotten spaces
Forces influencing this area of the Park


Combined Map in PDF.

Individual Force Maps.

Vegetation

An array of various plant types along a path
So much green in one spot!

In a town frequently plagued by drought and with a dry desert-like climate, things tend to be relatively brown throughout the city. Water is expensive and gardening in the sandy soil can be difficult. Balboa Park presents an array of greenery that is often not seen elsewhere in the city.

The Park houses a rose garden, Japanese Friendship Garden, Botanical Building, desert garden, Spanish garden and several others. There has been much time and money invested to keep these plants alive in the dry and sunny climate.

Large iron-wrought greenhouse
The Botanical Building, home to orchids and other native plants
Vegetation Map

Multicultural Tourism

Walkway with stone arches
Some of the unique walkways that house everything from museums to restaurants.

Balboa Park is a tourist destination in San Diego. The draw of the world-renown zoo and large variety of museums along with the unique architecture ensures there is always a tour group to be seen.  Tour guides are easy to spot as they generally have some sort of small unique banner on a thin pole. Occasionally there will be larger crowds of people being loaded onto or off of tour buses. A wide variety of languages can be heard throughout the crowds both in organized tour groups and smaller groups of visitors.


Tourism Map

Parking and Transportation

Lots of cars in parking spaces
The largest of the parking lots by the zoo.
Two scooters next to each other
Bird and Lime scooters.

There are four parking lots in the center area of Balboa Park, the largest being next to the San Diego Zoo.  Despite all being rather large, there is always a shortage of parking spaces, especially on weekends. People regularly have to find street parking along one of the main streets or in a surrounding neighborhood.  Because of the number of people who enjoy the various activities and the good chance that there will be a long walk between parking and destination, there have been additional transportation options established. One option is a shuttle tram which takes people between several stops. The electric scooter system that is used around the city as a whole as well as bicycles are popular options as well and also allow one to use them in areas of the Park closed to vehicles.

Transportation Map

Music

Throughout the hallways and plazas of the Park you can hear all different kinds of music. People come and play their chosen instruments for visitors. I have heard people singing, playing guitar, flute, violin, drums and other instruments. There is also the Spreckles Organ Pavilion which is home to an outdoor organ where organists play concerts weekly as well as for special events such as holiday celebrations.

Organ pavilion with a stage and rows of white benches
The world’s largest organ in an outdoor space.
Music Map

Forgotten Spaces

A quiet shady valley
Paths twisting down into a valley.
Walkways twisting down the side of the main area
This used to be home to the local nudist colony.

Despite hosting such large groups of people on a regular basis, the size of Balboa Park allows pockets of space around corners and down hills to remain relatively isolated. They are just far enough off the regular path, often down hills and away from the main attractions.


Forgotten Space Map

Project 2 – Mappings – Christina Bui

Site:  NorthEast Lakeside District


Force 1: Establishments

-Stonestown Galleria
 is the city’s only shopping mall that is not downtown, includes grocery stores (Target & Trader Joe’s), restaurants, and large retail chains. Its parking lot is shared with/surrounds banks, churches, and a movie theater.
These establishments draw people from all over the city as a source for a range of commercial needs. Anyone who doesn’t want to trek downtown would prefer to come here for its convenience and accessibility.
Lakeshore Elementary School, Lowell High School, & San Francisco State University.
These establishments draw families to move into the area for the convenience of schools of all levels.
San Francisco Zoo
The SF Zoo is also nearby within walking distance, providing a special place to go for families with children.


Force 2: Transportation/Traffic/Parking

Parking Lots/Structures
The parking lots of the mentioned establishments are shared/adjacent and thus blurring the boundaries of each establishment, creating a sense of community. There is an abundance of parking unlike the rest of the city, making it the easier choice for anyone with a car. (SF is notorious for difficult parking and downtown traffic.)
M-Line (MUNI) Stop
The M-Line is one of the main bus lines stretching over the city, making it a convenient stop for non-car owners as well.
Daly City BART Stop
For others, there is a BART stop within walking distance. BART is the fastest public transportation system in SF, often faster than driving if stations are nearby.
19th Avenue
This avenue is one of the largest streets in the city, stretching from the North Bay, through the Golden Gate Bridge, and down and turning into the 280 highway (the only other highway through SF other than the highly congested 101).


Force 3: Venues

Stonestown Farmers’ Market
A section of the parking lot is converted into one of SF’s largest farmers’ market every sunday, where many people come to buy weekly groceries.
Stern Grove Park is a venue for free concerts throughout the year.


Force 4: Groups

-San Francisco State University is the city’s only 4-year public university. This university brings diverse people from all over who want to live in SF after high school to pursue a college education.
Sunset District Locals
The Sunset neighborhoods are mainly occupied by families large. It has a more suburban vibe compared to the rest of the city. A large part of population who
frequents stonestown comes from Inner/Outer Sunset.


Force 5: Recreation

-Lake Merced Park
This area is lined on one side by 19th Ave and on the other by side by Lake Merced Park where people can golf, exercise, and relax.
Fort Funston
Farther west of Lake Merced Park is Fort Funston Park (a dog-friendly park) which lines the beach. Many dog owners in the city bring their dogs here to have fun off the leash in a city with limited space for dogs to run free.


For my synthetic map of these 5 forces:

Project 2: Gillian Eiserman

Historic downtown Vienna buildings on Church street
Historic downtown Vienna (Church Street)

The downtown part of the town of Vienna, Virginia, is a study in juxtaposition.  The main street, Maple Street, also happens to be VA Route 123, a major thoroughfare for Northern Virginia.  Along Maple street, you will find well-worn family businesses next to major chain stores and small boutique restaurants facing fast-food restaurants on the other side of the street.  One of Northern Virginia’s largest growing areas, and site of one of the United States’ largest shopping malls, Tysons, is just a few miles down the road and yet downtown Vienna still maintains a small town feel and charm.  Church Street runs parallel to Maple (VA-123) and is lined with unique small businesses and delicious, one-of-a-kind restaurants.  It is also home to Vienna’s historic district.  Despite there being major office buildings and a giant shopping mall nearby, just behind Church Street are dozens of small, single family homes that give the it feeling of suburbia instead of a metropolitan center.  Because of all of these opposing pieces, there are many forces that impact the downtown area of Vienna, Virginia.


FORCE ONE: TRAFFIC

A few cars driving down 123 in the middle of the day
Just a taste of the traffic to come later in the day

A staple of life in Northern Virginia, traffic is everywhere, and Vienna is no different.  There is consistently vehicle traffic through the main street (Maple Street), which also happens to a main highway (VA-123).  This traffic will then cause overflow onto Church street, since it runs parallel to VA-123.  During rush hours (we have multiple here), one will find both Maple and Church street packed full of commuters trying to get home.  Even on weekends, there is still a fair amount of traffic through both streets.  In addition to vehicular traffic, there is also the foot traffic of shoppers walking up and down the streets.

FORCE TWO: W & OD TRAIL

Brown sign with white lettering that reads W&OD Railroad regional park
Sign marking the W&OD Trail
two cyclists along the W&OD Trail
Cyclists along the W&OD Trail


The Washington and Old Dominion (W & OD) Trail runs directly through the downtown strip of Vienna along Maple Street (source).  This trail is heavily used by cyclists as well as joggers and their presence is a large force on the area.  The highway of VA-123 actually contains a stop light specifically for the trail crossing and it is not unusual to be stopped there for quite some time as bikers and joggers pass through.  Because of the trail, there are also multiple bike stores along the main street and nearby, and a brewery, Caboose Brewing, that is specifically stationed along the trail for thirsty cyclists.  It is impossible to experience downtown Vienna without being impacted by the W & OD.


FORCE THREE: HISTORY

Sign for the Original Vienna library from 1897
The Original Vienna Library, circa 1897

As mentioned above, the “historic district” for the town of Vienna resides on Church Street and certainly has a large impact on the area.  Everywhere you go, there are signs announcing it as the historic district and plaques describing various historical sites, including the original Vienna library from 1897 and Freeman Store and Museum from 1859 (source).  With so many markers and historic sites in just a small area, it is clearly that the history of Vienna is very influential on its current existence.

Freeman Store and Museum, circa 1856

FORCE FOUR: COMMUNITY

Sign advertising a local community holiday cocnert
Tiny Tots Community Holiday Concert


A sign for Children's Discovery Garden, sponsored and cared for by the local gardening club
Children’s Discovery Garden, sponsored and cared for by the local gardening club


Another prevalent force in downtown Vienna is the community.  Church Street has multiple signs and notices for community events going on, including  a “Tiny Tots Holiday Concert” at the local high school.  There is also a “Children’s Discovery Garden” that is maintained by the local gardening club.  There are frequently festivals and events going on along the street as well, such as an Oktoberfest, a Halloween parade, and a town celebration (source).  It is hard to walk down the street and not see a sign for a local community event or an invitation to join a new local group.

FORCE FIVE: ARCHITECTURE

Vienna clock shop with wooden front
The Clock Shop of Vienna (source)
Bazin’s on Church Restaurant

Perhaps a slightly more subtle force than the others, the architecture of downtown Vienna, especially along Church Street is unique and affects the overall feeling of the space.  There are several older, more historic buildings mixed in with newer, red brick buildings.  What I find to be most unusual is that several of the buildings have different facades and coverings than just plain brick or wood.  There is the clock shop with its wooden shingles and oddly angled roof, and then Bazin’s restaurant has a distinctive red face with large windows that set it apart from the other buildings nearby.  Whether it be from the 1800’s or the 2000’s, there is a very eclectic mix of architecture on Church Street that lends downtown Vienna much of its unique flavor.


MAPS

BASE MAP
FORCE ONE: TRAFFIC
FORCE TWO: W & OD TRAIL
FORCE THREE: HISTORY
FORCE FOUR: COMMUNITY
FORCE FIVE: ARCHITECTURE


PART 3: FINAL MAP

Map of Downtown Vienna (WIP)
Final Synthetic Map

PDF

As you can see, there were several iterations of my map.  I decided to remove the “Community” force because I did not feel it fit in well with the rest of the narrative my map was telling – how the area shown has grown over the past 200 years.  I still included the traffic because while it may not directly relate to any of the history of the area, I do think that it shows that now the majority of traffic and activity is not along the road where all of the historic buildings are centered.  I also took my cohort’s suggestions into account and lightened the background, removed the white outlines, and added numbers and names for the historical sites.  I had also added the dates those historical sites were built, but then removed it because I felt it made the legend look too cluttered and was not entirely necessary since there is color coding to at least show the era in which the buildings were created.  Overall, I ended up enjoying this project and the process much more than I expected.  I think this is in large part due to the fact that it was split up into more manageable parts, so I did not feel overwhelmed, and I also appreciated all of the critiques and comments I got as well as being able to look at my classmates’ work.  This is the first map I have ever created and likely my most detailed piece done in Illustrator, so it was great to get to work on my skills there as well!

Project 2: Joe Davis

HISTORIC DOWNTOWN APEX

Welcome to Apex, originating from a railroad station chartered in 1854; Apex is aptly named for being the highest point on a 30 mile stretch of the Chatham Railroad. Since it’s incorporation in 1873, Apex has grown into one of the top places to live in the United States. Money Magazine ranked it #14 in 2007, #9 in 2013, and #1 in 2015. Despite these claims to fame, Historic Downtown Apex has been able to retain much of its character since 1912, after two fires caused the town to turn to fireproof brick designs. The town is listed, by the National Register of Historic Places, as a quintessential example of a “turn-of-the-century railroad town” (Apex).

tl;dr My site is the historical downtown region of a town called Apex, with its origins in the railroad industry. 

BW Photo of a railroad with house in background
Apex’s origins are in the railroad ( Which is still in use)


DOWNTOWN APEX WALK-THROUGH

https://youtu.be/3CtCWikUU2s


HISTORIC ARCHITECTURE

Much of the charm of Historic Downtown stems from the site’s architecture. Many of the brick businesses were built around 1912, however, I suspect some of the wood houses to be older. My knowledge of architecture is limited, but I have tried to catalog some of the more unique buildings at the site. The history of these buildings helps sell Apex as a quaint town, despite the massive developments that are popping up in the surrounding area. There are two main occupants at the site, residents and businesses. I would argue that historic architecture, businesses, and residences are three separate forces.

tl;dr Historic downtown has some cool old buildings.

Historical residence on a field of grass with clear skies in the backdrop
Historical Downtown is filled with thought provoking architecture
Fire station on the right and business on the left. Train in the backdrop.
Influences of Apex’s railroad origins are present among the architecture


BUSINESSES

Many of the buildings along Salem Street, the road that runs through downtown Apex, are businesses. These businesses include coffee shops, clothing stores, and art studios. Not all businesses are in historic buildings, it is therefore necessary to be able to differentiate between which buildings are both a business and a historic site, and businesses that have no historical relevance in the context of Apex.

tl;dr There are many businesses in downtown, while the majority are inside of the historic buildings, there are exceptions.

White brick building with a shop nested inside. Red canopy hanging off building
Art Studio in Apex’s Historical Downtown region
Historical building with shops. Two stories with several windows along top.
Businesses nested between train tracks and Salem Street
Pizza hut in a small strip of businesses. Concrete building with wood roofing.
Not all businesses are located in historically relevant buildings.


RESIDENCES

While many of the buildings at the heart of historic downtown are businesses, there are residences adjacent to Salem Street. As you get closer to a cluster of historic buildings, you start to see less residences and more businesses housed in historic buildings. This dichotomy is easier to understand in the maps below. Many of the residences appear to be currently in use. There was only one house that was obviously abandoned, featured as the first picture of this post. Additionally, I only noticed a single modern house in the vicinity of my site. Unfortunately, my lack of architectural knowledge prevented me from further distinguishing between the different eras, style, and design.

tl;dr Businesses are clustered at the center of historic downtown, with residences on either side.

Historic Residence One
Historic Residence Two
Historic Residence Three
Historic Residence Four


GOVERNMENT

Government is quite prevalent in downtown Apex; the chamber of commerce, police station, and volunteer fire station all show signs of an organized community. There are additionally street signs, street lights, cross walks, utilities, a parks and recreation department indicating the presence of government. The preservation of the town and the historic buildings also further implies an outside influence protecting the site.

tl;dr Government buildings and signage are prevalent at the site.

Building in the background, trees on the sides. NC Flag on flag pole. Court yard in front.
Apex Chamber of Commerce
Red brick building with the words Apex Volunteer Fire Dept
Apex Volunteer Fire Deptartment
White building (right) originally the town hall, transformed into a cultural center


TRANSPORTATION

One of the first forces I noticed, while walking around my site, was transportation; numerous parking lots, parked cars, moving cars, speed cameras, sidewalks, railroad cars, railroad buildings, and train tracks all indicating that transportation was important to this site. The railroad has its roots in the founding of the town as mentioned above, and its current use can still be encountered on a daily basis. The vehicle traffic is impacted by Salem, the road that runs through downtown, being used to cut across Apex. Thus, the traffic is often a mix of those looking to visit the historic site and locals trying to get to their next destination across town.

The sounds of traffic

tl;dr Downtown Apex, like every town, is impacted by cars and parking; a railroad runs parallel to the site.

https://youtu.be/DIIKtBdqq_E

In the background is trees and a train. Multiple vehicles parked in the foreground
Train Tracks and Vehicles Parked


Red train caboose with sign in front. Grass in foreground blue sky in back.
Train Caboose reflecting Apex’s Heritage

FINAL MAP & HISTORY OF REVISIONS

My major challenge with this project was in designing a perspective map that could show information in both a clear and aesthetically pleasing manner. I originally designed this with a detailed background base map. However, it became clear that this made it difficult to differentiate between the base map and my icons. Reducing the opacity of the base layer made the icons clearer, but eliminated the 3D appearance. Thus, I decided to make one final major edit. I also updated my mappings of residences and business, and made a few corrections.

I included my mapping of the sun, though this will soon be outdated, and I updated most of the graphics in the mapping to appear 3D. This update eliminated the need for the background map. It also allowed me to greatly reduce my use of icons, as the 3D buildings themselves now map their purpose. I’m still unsure on the aesthetics, but I am happier with the clarity of the map. I also made a fake logo, with a black and white vector version of my map in the center; it points to Apex, a play on both the word and the slogan “the peak of good living.”

tl;dr I made a final major update to my map, it features 3D buildings and a mapping of the sun.


REVISION FOUR – FINAL

PDF LINK

Perspective Map with sun arcing over. Legend on right. Logo in top right
Final map


REVISION THREE – OBSOLETE

PDF LINK

Five Forces – Revision 4
Base Map – Revision 3
Transportation – Revision Three
Historic – Revision Three
Residences – Revision Three
Business – Revision Three
Government – Revision Three


 REVISION TWO – OBSOLETE

Map of Small Town from an angle
All Forces – Revision Two


REVISION ONE – OBSOLETE

All Forces – Revision One

DATA

Information on the history of the Apex was pulled from Apex’s website. Proportions and dimensions of maps pulled from google maps. Earlier revisions, excluding the final, used stitched images of google maps, satellite view/perspective to provide additional context and depth to the project.

SOURCES

Apex North Carolina, www.apexnc.org/225/Our-History. Accessed 20 Nov. 2018.

Apex, NC  Google Maps, 20 November 2018. https://www.google.com/maps

Project 2: Sofanah Alrobayan

PART 1

Site 

The site I chose to visit is a business complex in Irvine, California. It is located on the intersection of Laguna Canyon Rd. and Irvine Center Dr. It is home to many different companies where they all share the outdoor space I chose to observe. From the parking lots to the courtyard, here are the five forces that stood out to me.


Parking

There is an abundance of parking spots for different types of vehicles. Cars, motorcycles or even bikes have a place to park around the buildings. The majority of the people that work here seem to prefer to drive to their workplace rather than ride, whether it be motorcycles or bikes. The parking lot definitely caters more to motor cars than bikes. There is also a specific number of parking spots per building reserved for accessible parking. Overall the parking lot doesn’t seem to be crowded by any means at any given time of the day.

Recreation

The courtyard common space area named “The Commons” at this business center can be a place for people to engage in friendly games for when they need a break. They offer horseshoes, connect four, and even corn hole all around commons. That whole area is intended to be more relaxed than a typical workspace. Although, there are some people that like to take their work outside, the majority of the people in this area seem to come out for a break, whether it’s to chat with a friend, have lunch, play some games, or just read a book. It is a place to unwind. There are also company sponsored events that can be held at the commons and its layout definitely helps in terms of space and arrangements. Another space (not pictured) is a game room located inside on of the buildings that surround the commons and is open to the public. It includes a kitchen, some dining spaces, a mock living room with several TVs, a pool table, a foosball table, and some arcade games as well. The relaxed and fun atmosphere is an effect resulting from this recreation force in this space.

Green 

This site is exceptionally green. The grass, the trimmed bushes, the different types of trees, and even potted plants are a huge force in this space. The trees and bushes line up around buildings, parking lots, walkways, curbs, and the commons area. There is not a single space to stand on the site where greenery is not in sight. The idea of this site being surrounded by “nature”perhaps creates a sort of positive atmosphere that allows people to view the workplace as more of a “natural sanctuary”.

Signs

There are so many signs and labels scattered throughout the site that portray different conditions. All signs are informative, but some are more serious in tone such as the “No Parking” or “Minimum Fine $250” or “PLEASE DO NOT DRINK”. I even considered the “Recycle” label on the recycling bin to be a sign since it is trying to inform people. Other forms of signs the can be seen throughout the site are the stop signs around every intersection inside the complex, directories in front of every building where each company in that building is listed, and in some cases, some companies have their name on the buildings themselves versus only on the directory. The signs are a force that inform the people about the area they are currently in.

Seating

There are many seats scattered throughout the outdoor space. Although they are dispersed, the majority is centrally located at the commons area. One might even argue that the lawn is also considered a seating area. There are benches at the smoking area, some tables and chairs tucked away by some buildings, and an abundance of seating choices at the commons area, from large cushioned chairs to wooden lawn chairs.


PART 2

Parking

Recreation

Green

Signs

Seating


PART 3


FINAL REVISION

Project 2: Cassandra Hoo

Pan Pacific Park Google MapPROJECT 2 – PART 1 Since it was a beautiful Fall day out, I decided to explore Pan Pacific Park. It’s situated right behind the busy Farmer’s Market on 3rd and Fairfax and The Grove LA. It’s also flanked by the Palazzo and Parc LaBrea apartment complexes on 3rd Street; residential housing on Garner Street; and The Broadcast Apartment complex, Erewhon grocery store, USPS, and chic restaurants on Beverly Boulevard. Due to its diverse recreational, athletic, and leisure offerings, it’s a very popular place for people to play, unwind, socialize, and workout.

Force #1 — Education and Activity Centers:

The park has several main hubs for people to enrich their lives. On the northside of the park, near Beverly Boulevard, is the Los Angeles Museum of the Holocaust. The museum is a beautiful building that seamlessly integrates into the park landscape and attracts visitors from near and far. In front of the museum is a small outdoor amphitheater. Although I’ve personally never heard of any performances happening there, it’s a nice area where I see people either relaxing or running laps. On the eastside of the park is the Pan Pacific Senior Living Center. The facility has a community room, kitchen, auditorium, gym, computer lab, and dining hall. The building hosts all sorts of activities; from bingo, to Hatha yoga, to acting. Adjacent to the Pan Pacific Senior Living Center is the Fairfax Branch Los Angeles Public Library.

Force #2 — Picnic and BBQ Areas:

There are plenty of lone picnic benches and BBQ pits scattered all over the park. There are also two large covered areas that can be rented out for parties that house more picnic tables and a grill. During my observation, I saw four birthday parties going on (one in each covered area and two out in the open on the grass). There were also people casually barbequing and eating with friends at various picnic tables.

Force #3 – Exercise and Team Sports:

The park has so many solo and team exercise opportunities. The park has a soccer field, outdoor swimming pool, three baseball diamonds, an outdoor basketball court, bodyweight workout circuit, and a set of monkey bars. There are also plenty of paths for people to walk, run, and bike on.

Force #4 – Playgrounds:

The park has two large playground centers for children to explore and play to their heart’s content. During my observation, I saw a plethora of children playing while their parents either played along with them or supervised from a safe distance and socialized with other parents.

Force #5 – Wide Open Space:

In general, the park is one big playground for people to use and explore in a multitude of ways. Children, adults, and dogs run across the grass to frolic and play games. Many people also use the space for quiet and solitude as they sit in a in either the shade or the sun and soak up the surroundings.


PROJECT 2 – PART 2

Base Map: 

Pan Pacific Park Map

Force #1 — Education and Activity Centers:

Force #2 — Picnic and BBQ Areas:

Pan Pacific Park Map - Picnic and BBQ Areas

Force #3 – Exercise and Team Sports:

Pan Pacific Park Map - Exercise and Group Sports

Force #4 – Playgrounds:

Pan Pacific Park Map - Playgrounds

Force #5 – Wide Open Space:

Pan Pacific Park Map - Wide Open Space


PROJECT 2 – PART 3 – V1

Pan Pacific Park Map - Part 3

Download PDF

One of the most challenging aspects of this project was figuring out what to focus on. There is so much going on in Pan Pacific Park and its surrounding areas. While I initially just wanted to focus on the park, Jesse suggested that I include more of the areas around the park to show how it’s an oasis in the middle of everything. I extended the map to include The Grove, 3rd Street Farmer’s Market, the Town & Country Shopping Center, and more of the residential areas to the east of the park. I colorized the commercial buildings as light blue and residential areas as dark grey. I decided to include high traffic areas, because I wanted to show how congested and busy certain main arteries are close to the park.

In the park itself, I cleaned the map up and simplified it a bit. I added sports icons to easily reveal key group sport areas. I found this was more effective than numbering each baseball field and redundantly writing, “Baseball field” three times on the map key. I also removed the picnic tables and BBQ grill icons, because I felt they were too small to see. Instead, I added a dark green transparency over the green field to show popular leisure areas where people congregate to have picnics, celebrations, and play fetch with their dogs.


PROJECT 2 – PART 3 – FINAL


Pan Pacific Park Map - Part 3 - V2

Downloadable PDF

I decided to take Serena’s advice and reduce the perimeters around the park. My Part 3, V1 map had so much extraneous space around the park, that the park was dwarfed by its surroundings. I also decided to just number the important buildings inside the park instead of important areas inside and outside the park so that the park had more prominence.

Project 2: Grace Guo

Screenshot from Google Maps

For my site, I chose to visit a food plaza near my house at night roughly around 9:30PM. This area is highlighted purple on the map above. This center features a  wide array of primarily Asian restaurants and cafes with a Lollicup, a popular Taiwanese boba spot, at its center. It is also located across the street from another plaza with a 99 Ranch Market, other Asian specialty stores, salons, and cafes.


Rough sketch of the area.

FORCE 1: HANGOUT SPOTS

In my (embarassingly juvenile) rough sketch of the area (Figure 2), I depicted popular hangout spots by drawing stars and later coloring them in either red or orange to indicate intensity (red being more popular). I noticed that the center of the plaza, Lollicup, was the most popular area for people to just sit around and talk. There were more people seated outside Lollicup than there were seated in the gazebo.  People also tended to gather in front of the fountain that faces the street just to stand and talk. However, I noticed that people usually stand in front of this fountain either when they are getting ready to head back to their cars or when they have just arrived at the center and are figuring out what to do next.

Force 1: Hangout Spots


Pond by Lollicup and the sitting area

FORCE 2: LANDMARKS 

At the front of the plaza, there is a fountain. From that point, there is a mini manmade nature path that leads to a centrally located manmade pond that is right next to the gazebo sitting area. There are 3 mini nature pathways (paths with pebbled flooring and a lot of shrubs surrounding) that branch off from the pond and lead to the back of buildings.


Force 2: Landmarks


Path to nowhere

FORCE 3: FORGOTTEN ZONES

The photo to the left shows a little manmade nature path that leads to a dead end in the center of these bushes. When one reaches the center, there is nowhere to go but back. I have never seen one person utilize this path. While on the topic of pathways, other forgotten zones included the pathways leading to the backs of buildings. While these pathways are built as a shortcut to the other side of the center, I noticed that most people tended not to take these paths because there is another parking lot located on the other side. Therefore people park on the other side if they are trying to visit one of the shops on the other side. It is rarer that someone will park on one side and walk through to the other side if they already know what they came for because that would equal more walking.

Force 3: Forgotten Zones


FORCE 4: ASIAN RESTAURANTS & CAFES

This center offers a large variety of Asian restaurants and cafes from various Asian cultures. Some of the more popular restaurants and cafes include: Taiko, A&J Restaurant, Shik Do Rak, Lollicup, and 7 Leaves Cafe. Unsurprisingly, there are more Asians in this plaza than other races. Even so, there was still quite a bit of diversity. During my observation, the ratio of Asians to non-Asians was probably about 7:3. 

Force 4: Asian Restaurants and Cafes


People sitting inside Lollicup

FORCE 5: NIGHT OWLS 

As this center is very Asian-centric, another hallmark of Asians is that they love to go out at night. As a result, quite a few cafes, restaurants, and dessert shops in this area are open late (past 10PM). A cafe that does an excellent job catering to the night owl demographic is Lollicup. Lollicup decorates their main sitting area with hanging string lights that create a nice ambience at night. People are often seated outside talking. Meanwhile, they also play music inside and light up their walls with color-shifting LED lights, which adds a pop of festivity to the area and makes it all the more alluring for the night owls.

Force 5: Night Owls

Map of all 5 Forces:


Project 2: Tara Suan

Final Map:

Alright folks. Uncle. If I had way more time to spend on this I would do it again in totally different ways. I changed the cars visualization and added more people. I also added the buildings back in for more reference. And a title. Thank you to everyone who helped me learn during this project! Happy nearly Thanksgiving!

Link to pdf

Second to the Last Map:

Map of Crossroads Shopping Center with forces of shopping cars, people, cars and busses
Shopping cart dispersion, interaction with people, cars, and busses

My observation of the Southern edge of this shopping center became a study of shopping carts. The carts are a clear and visible force that goes largely unnoticed.

Individually, carts are very present in the lives of shoppers who need them to transport their purchases. Taken at the aggregate level, shopping carts represent a host of interactions: awaiting shoppers with the assurance of free hands for goods-gathering; under the command of satisfied shoppers heading to cars; returned to the parking lot “corrals”; and awaiting the next run from their holding pens.

Shopping carts are also traces of the people who pushed them. Carts end up dispersing into the environment. Some hasty shoppers abandon them in the parking lot, where they drift waywardly to settle across multiple parking spots, the cars seemingly repelled by a dent-circumference.

And carts end up clustered near bus stops and beyond, ranging far from their base of operations. How might the purchases of people in cars differ from people on the bus? For the next round, I will try to layer in a story of demographics of the people who live and shop in Bellevue, and how having a car vs taking the bus might indicate economic or social forces. I should be able to run some simple R code to get census tract data for the areas around this shopping center.

As for feedback – I could use it! I’ve focused on trying to get the forces – carts, people, cars and busses – to interact. Thoughts appreciated, and anything else you’d like to comment on!

Link to PDF

*** Initial post ***

I’ve chosen the edge of Crossroads Shopping Center in Bellevue, Washington as my mapping site. For my first observation, I selected the intersection of NE 8th St and 156th Ave NE with an upper bound of what would be NE 10th had it intersected the shopping center; a lower bound of the south side of NE 8th St., and to the East, 164th Ave. NE.

The southern edge of Crossroads Shopping Center

For my exploration pathway, I crossed the Crossroads parking lot, then walked up NE 8th St, and took a side trip through Bellevue City Crossroad Park. On my way back towards 156th, I crossed NE 8th and walked along the other side of the street, passing by the United States Post Office, a discount grocery, and a gas station. On my way, I noticed forces at work on the space.

Parking and streets

Sign prohibiting parking without shopping

One cannot escape the formative hand of the city of Bellevue and it’s commercial partners in developing this area. One way that is evident is in how streets and parking are manifested. The streets are very large to carry a high volume of cars and public transportation. There is no parking along the street. Instead, all of the parking is in parking lots that are made to be used only when you are shopping. The parking is plentiful if you are planning to do some shopping, and there are strict looking signs that govern the use of the parking lot. No walk-offs, no overnight parking. However, on my wanderings, I have seen people park along the periphery of the lots, and take a quick snooze before the parking attendants come through to shoo them away.

Garbage

Trash receptacles to keep up with the retail

This much shopping has to mean garbage. There are trash containers everywhere, somewhat hidden, but not really. There are some that are bigger and smaller, all kinds of trash in the form of old retail displays, pallets, and whatever other trash comes off of the steady stocking of retail shelves. There is also some garbage from election signs, and from people sitting on the outdoor benches and littering. But there’s not much garbage on the streets.

People

Crosswalk

Pedestrians and ferrying them safely into the shopping stores is paramount. There are many features to keep families safe as they travel from a street or parking lot to the safety of the big box retail store, such as crosswalks and speed bumps. There are many types of people, shoppers, retail workers, service people, and some guards.

Shopping Carts

Shopping carts are a force all their own. They are emblematic of retail, a necessity to store and transport purchases to awaiting cars in parking lots. The carts end up everywhere, often on the periphery of the space, where those without cars have pushed them as far as they will go. Meanwhile, there are many attempts to store and organize the carts themselves, and specially built corrals for them to rest in before being returned to the store for another ride.

Public Transportation

The 245 and B line buses are the main way people get around if they don’t have cars. There are several stops that service this area. Around bus stops, we see evidence of Desire Lines, paths that have been cut through the planters that allow people the most direct way to get to the business end of the bus stop.

Nature / Decay

As with many city streets and commercial/residential areas, nature isn’t natural. it seems like every plant, bush and tree has been planned and planted. Even the dirt is carried in. No matter, the effect here in Washington is quite stunning, especially the trees. This fall, my first here, I watched with wonder for a month as beautifully colored leaves changed colors, fell in carpets, dried to a dry rustly crunch. Just this week they’ve become a sodden mess in the ensuing rain.

There are other signs of decay – small, soft pine cones afford rolled ankles for careless walkers; rat traps hint at the underworld.


*** second post ***

Six force maps

Traffic (plus roads and parking, all related)

Public transportation (not many stops, but lots of lines)

Nature (many trees)

Decay and waste (leaves and garbage)

People (where they frequent)

Shopping carts (strewn about, and collected)

Project 2: Kathy Emsoff

Project 2, Part 1

The site I chose for my site is the intersection Palm Way and Rock Rose in the Domain area of Northwest Austin. In recent years, Austin has grown like crazy and the Domain is a new and popular development with restaurants, bars, shopping, offices, and rental housing. It has managed to attract some big names too like Neiman Marcus, Whole Foods, Apple, and HomeAway. It offers some of the fun and interest of areas downtown, but is more accessible to people who live North and feels a little safer. Unlike downtown, there are no homeless people and it is much cleaner, but lacks the grit, charm, and authenticity of downtown. Despite that, the area has a lot to offer, appeals to a lot of people and there are a number of forces her at work including: commerce, technology, community, creative, and the tension between growth and authenticity.

Free People and Theory storefronts
Free People and Theory are among the many clothing stores.

Commerce
Commerce is an overarching theme with tons of stores ranging from mid to high-end and a wide variety of restaurants that become bars at night. At this intersection alone are a number of popular restaurants as well as shopping like Theory, Diptyque, Free People, Apple, and Sephora. The total Domain actually covers three different shopping areas with stores ranging from standards like Macy’s and J. Crew to very high-end stores like Louis Vuitton and Tiffany. The Northside section is the newest section and this is the location of my site. It also has lots of stores, but they seem to cater to a slightly younger and hipper crowd. There are also a lot more bars/restaurants in this area. The bars and restaurants draw different crowds on different days of the weeks. During the week, there are a lot of groups of office workers and business travelers having happy hour and on the weekends, there are more families and groups of friends.

The front of the Apple store.
The Apple store is a main attraction and always busy.

Technology
I chose the Apple store to represent technology, but Apple also fits within Commerce. The Apple store is always buzzing and it’s about twice the size of their previous store, which was only about three blocks away. In addition to retail technology, there is lot of tech companies. Amazon and HomeAway have offices here and Charles Schwab, IBM, and National Instruments are all within a 5-minute drive, which is really short for Texas.

From dogs and kids to community sponsorship, the Domain is trying to build and support the community.

Community
There seems to be an effort towards inclusiveness and building a community here. This is the first planned, ground-up mixed us development in Austin that brings together housing, retail, and office space together into one place and I think they have gone out of there way to consider a few of the different types of people that would use this space and to make it feel like a community. The Apple store has a place where kids can play. Many of the business put out water bowls for dogs and there are stations that have pet waste bags. There is also a great display of art by the Hope Gallery that is a non-profit gallery that gives street artists and community groups the opportunity and venues to display large-scale art in public.

A funny monster artwork painted on the side of a restaurant.
The takeout window of a local restaurant.

Creativity
There is also a great sense of creativity here. Many of the buildings have artistically painted exteriors, creative signage, and great design elements in their indoor and outdoor spaces. There is a green space across from the Apple store that sometimes hosts out door bands and some of the restaurants do as well.


A building crane and a street sign for Rock Rose.
Lots of growth in this brand new area, but the developer attempted to bring in some of the Austin flavor with the name of the street and local restaurants.


Authenticity versus growth

If the community and creativity aspects of this area feel a little manufactured, it’s because they are. Like I said, this place is new and was built from the ground up and there is growth all around as you can see by the two cranes that were visible from the intersection. Austin has a strong and vibrant culture and I think they were worried people would reject such a new place. To mitigate this, they named the main street of this new section “Rock Rose” to try to appeal (or borrow interest from) Austin’s musical heritage. The first set of restaurants that went into Rock Rose were all local and this garnered a lot of press. It doesn’t feel like Austin, but it also doesn’t feel like you’re at a totally vanilla and uninspired strip mall either.


Project 2, Part 2

Note: I have changed up my forces a bit. As I visit the site more, I realized that the authenticity vs growth is more my perspective and commerce was too broad.

Community

Creativity

Fashion

Food & Drink

Health & Beauty

Technology

Project 2, Part 3 – DRAFT

Note: I continue to change my forces as I think more about the area. When I wen there to do the Geographies project, one thing that struck me was how often I come here, but how few of the stores I actually interact with. That caused me to think about the different use cases for the area. Some people come to eat and or drink. Some come with their kids for entertainment. Some come just for shopping, so I’ve adjusted my forces to think about the intersection of those different forces, how some areas are dominated by a single force and some have several together. To further illustrate this, I changed “fashion” to “shopping” because it’s such a dominant force.

I’m still working on this and thinking through the best way to show the intersections and how to refine the design a bit more.

Also, just for fun, I have included a couple of rejected ideas (don’t worry, they are both under 100k).

Domain Northside forces

Rotation experiment

I experimented with rotating/skewing the whole thing to display a bit more perspective. I ended up moving away from this idea because, although I thought it looked interesting, I felt the design might have reduced the clarity. I also couldn’t figure out how to do the scale if the image was on a perspective, then the scale was different at different parts.


Photography experiment

I also experimented with photography but moved away from this idea because the photography added so much visual complexity that I had to abstract the forces too much. This caused it to lack some of the information and detail in the examples from the other students. Also, it kind of looks like an ad and not really a map. Also, I’m tired of the colors. They are just too bold and I’m really tired of this design. I like the photos and the inclusion of the “creativity”, but that’s about it.

Domain Northside photos and forces


Part 3, final submission

Okay, I went back to my site on Thursday evening to eat dinner with my husband. There was music playing from various places and children playing football on the lawn, so I’ve changed up my forces again to include music. Additionally after reviewing some of the other students’ work, it occurred me that I need to vary my visual depictions to help distinguish them from each other. Please let me know if you have any feedback on something else I could to improve by the Tuesday deadline.

Forces at the Domain NorthsideLink to hi-res pdf

Project 2: John Molendyk

Garden Center 2

My map is of Garden Center #2 in Laguna Woods, Ca. The center is diverse with many forces that I have been a part of for several years. This garden center has been here since 1965 with many of the gardeners having the same garden plots for almost 30 years.

Garden Center 2 – Combined Force Map

Hydrating Forces

Water into a gardeners plot

A garden’s life blood is water and so the force of hydration within the garden center is critical to its survival. Here, I have represented the force of hydration as the foundation for the rest of the garden both theoretically and logistically. What isn’t seen here is the myriad of pipes that connect to each of the gardeners plots. With over 400 vegetable plots and 120 tree plots, the water is really everywhere as each gardeners is responsible for accessing water from their neighbors lead. Some plots have 2-3 outlets of water within their plots.

The force of hydration within garden center #2

Giving Forces

Many of the members of the garden center have come together over the years to grow food for the local food pantries. Lou, one of the gardeners with a long history at the garden center had upwards of 20 plots at one time. Lou kept track of how much food he grew and donated for the past 10 years with 100’s of pounds donated every year. Additionally, there are tables located throughout the center where people will leave various things such as food and excess seeds and seedlings from their gardens.

The giving force within garden center 2

Creative Forces

A headboard is re-used in garden plot

The gardens are a place where people play in the dirt and express themselves with the design of their plots. Many of the gardeners have personalized their plots with brightly painted signs, statues and other works of art. For some, it may not be too much about gardening anymore than it is about self-expression. It’s also wonderful to see people re-using in the garden center; gardeners are resourceful people and will create something from very little materials. Here we see a headboard used at the base of a shallow bed. I can imagine sugar snap peas covering the rungs in early fall.

The force of creativity at garden center #2

Renewal Forces

A sitting area under a green awning.

The forces of renewal are hard to map within the garden center because in reality, the entire garden center is a force of renewal. Every year gardeners look forward to the seasons where they can grow their favorites vegetables. Each season is renewal in itself. Here, I have taken the concept of renewal to be physical rest, rejuvenation and coming together into the common and not so common resting areas of the center. During late afternoons and weekends it’s not uncommon to find a handful of gardeners eating lunch and sharing ideas about how to get the best tomato.

The forces of renewal at garden center 2

Transformational Forces

A new plot being built for a new plot owner.

There are many forces of transformation in the garden center. Many of the transformational forces feel much like forces of renewal as there is a lot of overlap in the concept if looked at from various angles. Here the force of transformation is looking at the constant state of construction in the garden center. Many of the current structures are more than 30 years old. In the late 80s gardeners began building structures to minimize theft and personalize their space.

The force of transformation at garden center 2


PDF Document for Combined Force Maps

PDF Document of Revision History

Project 2: Young Sun You

PART 4

PART 3

The main insight I felt on my site was diversity, and I wanted to represent it on my map. But feedback and everyone’s maps helped me realize that my forces were too specific. For my final map, I tried to widen my forces, while trying to keep the focus on diversity.

PART 2

Base map

Variety of food + ethnicities

Activities

Quiet places + water

Parking

Traffic

PART 1

I chose The District at Tustin Legacy as my site. Many restaurants and shops have been renovated and the mall has been turned into a lively atmosphere. I observed a part of The District at the intersection of Barranca Pkwy and Jamboree Rd, and another at The District and Park Ave. The overall feeling of the area is clean, organized and active.

Variety of food + ethnicities

The area has a fun collection of restaurants, bars, desserts and cafes and there were various types of food from many ethnicities and cultures. The place does not lean towards one particular food or tradition, and many things are well blended together.

Activities for all ages

There are a variety of activities for all ages, from kids to adults. Each shop has its own vibe. Here are a list of a few activities and shops based on my observation:  

Quiet places + water

The area with the Union Market and AMC is quieter and more leisurely than the area with the grocery market and Costco gas station opposite to it. I also noticed that the area around the fountains is mostly quieter than the other areas. The size of each fountain is not huge, but water sounds give a relaxing feeling in the artificial area. There are always rest areas next to the fountains. Many groups of people are taking breaks around the fountain area.

Parking

There are huge parking lots around this area. They are mostly public parking but I could see the valet and Uber/Lyft lounge at a location. Also, the electric vehicle charging stations were available and many people were charging their cars at the parking lot. The front of most parking lots have 20 minute parking areas and loading zones for pickup.

Traffic

There is a certain area that always has a heavy traffic. The busiest road is where the Costco gas station and Whole Foods are. Most roads are not that busy but traffic is always slow because there are many stop signs and many people cross the street.


Project 2: Rona Matsumoto Cabrera

Osaka’s Tanimachi 4-Chome Area (The Chuo Ward)

Scroll down to Project 2 Part 3

Project 2 Part 1

Here I present a train map of the central area of the Osaka Prefecture:

Colored in red is the area I will be exploring where the center is the Tanimachi 4-Chome Area.


Here is a google maps picture of the the area:

Force 1: Ethnicities

Although the Tanimachi 4-Chome station is two stations away from the popular main line (the red Midosuji line), not too many foreigners are visible in this area. When I do see some foreigners, they seem to be headed towards the Osaka Castle. Tanimachi doesn’t have any tourist attractions and is considered a residential area that is next to the business district of Osaka. For the most part, the ethnicities are homogenous with the majority being of Asian decent.

Force 2: Landmarks

Aside from the major shopping districts and towers in Osaka, the Osaka castle is also a huge tourist attraction. However, since most people take a subway line to go to the castle directly, unless one is inside or near the vicinity of the castle, most tourists are not wandering around the Tanimachi 4 Chome area. The castle unfortunately is not visible until one goes inside the grassland vicinity. It remains hidden and is surrounded by a body of water around it.

Force 3: Traffic

While several cars and taxi pass this area, there are many people walking and riding their bikes on the road. Most of these people are in suits. Although it is technically illegal to ride on the sidewalks, almost no one actually rides their bike on the actual roads.

Force 4: Food Convenience (& Affordability)

Convenience stores are everywhere in Osaka and are also ubiquitous in this district. One thing to note is that the grocery stores that are extremely cheap around the southern area of Tanimachi. Spices and sauces are less than a dollar in the left image above and are 1/3-1/2 of the price sold in major markets.

The image on the right shows a simple meal from a chain store “Zenya” where all this fresh and healthy food can be consumed in less than 6-7 dollars (Japan doesn’t take tip so it really is a steal). Food is definitely cheap and affordable in this district.

Force 5: Safety

Tanimachi is rated one of the safest areas in Osaka and this may be attributed to the police stations that are located there. These police stations are open 24 hours a day so their existence most likely help foster the image of safeness in the area. Hospitals and clinics are also available within walking distance.


Project 2 Part 2

Despite my chosen site covering only around a mile, it is very dense in terms of people, tourism business, and stores.

Force 1: Ethnicities

Force 2: Landmarks

Force 3: Traffic (Cars and Pedestrians)

Force 4: Food Convenience (& Affordability)

Force 5: Safety


Project 2 Part 3

Incorporating some advice to declutter/clarify my map, I muted some colors and decided to use some shapes with lower opacity instead of the feather effect. I also used decreased the amount of distinct colors used so it’s a little easier on the eyes. Here is the higher resolution version.


Project 2, Mappings: Clara Huang

Contrary to the downtown districts in most cities, downtown Los Angeles (DTLA) is not the heart of Los Angeles. It’s in a central part of the county, houses City Hall and much of the homeless population, and has gone through renaissance and revitalization just in the last five years.

Parts 1 and 2: Forces

Force 1: Fashion and Jewelry Districts

Jewelry District in downtown Los Angeles
A street corner in DTLA’s Jewelry District

Downtown’s many areas are all in wildly different states of development and gentrification. The Fashion and Jewelry districts are representative of what DTLA used to be in the early 20th century: a hub of commercial growth largely due to banking and rail development. These days, these districts still house specialty stores that sell wholesale goods, but they are distinctly behind the times—you won’t find too many Instagram influencers walking around here. They have become old and weathered, and turned into the slightly more unsavory parts of downtown. Walking around, it’s likely you’ll witness all those parts of city life you’d rather not, like feces in the street and likely mentally unstable people shouting at nothing.

Force 2: Public Transportation

Pershing Square
The Pershing Square metro station, with a lighter crowd on Sundays

As I have begun to explain in previous exercises, public transportation is another force that drastically affects DTLA. Downtown is the hub of the LA Metro. Union Station connects the underground metro, Amtrak/MetroLink trains, and Metro light rails. There are rapid transit buses that connect many cities to DTLA, like the Silver Line that runs from San Pedro in the south to El Monte in east LA. Metro rail lines run from the 7th/Metro station downtown to Long Beach and Santa Monica. Public transportation not only allows people to move more easily between various regions in LA, but also provides refuge for homeless people in LA. In downtown LA especially, you can see that people congregate in or outside metro stations to rest, recharge their phones, or just exist. Development also pops up around metro stations, driving up property value.

Force 3: Skid Row

Of course, downtown LA is also where Skid Row is located, containing one of the largest stable populations of homeless people in the country. It’s a sobering area to pass through, and one that people unfamiliar with the area are often surprised to find in such close proximity to the wildly gentrified Arts District and Little Tokyo neighborhood, and next to City Hall. In the rest of LA, you can generally find homeless encampments on some sidewalks, in underpasses, and in less-trafficked areas. In Skid Row, sidewalks are lined with tents and tarps, trash is piled up in the streets, and people who live there walk on roads ignoring cars as if they own the place (which they do). Skid Row is where local governments around LA and OC cart their homeless populations to, as if when they ship them away they disappear. It is a visual reminder of the failure of our society, and most people stay away.

Performance at Weingart Center on Skid Row
A community performance at the Weingart Center on Skid Row

I am lucky to know people through work that have created outreach programs bringing music to Skid Row. Major arts institutions like the LA Phil, The Broad contemporary art museum, The Music Center, and my own place of work are just a stone’s throw away, full of the kinds of privileged people that come to LA to “live their best lives” and never think about homelessness.  These outreach programs bring some of those people down to Skid Row for community performances and classes, and I had the opportunity to attend one of their concerts this past week.

Force 4: Arts Institutions

Gala on Grand Ave
My work’s gala on Grand Ave, with views of the Broad museum and Walt Disney Concert Hall

The arts institutions of DTLA are another major force in the area, bringing

revitalization, culture, and tourism to the city. Walt Disney Concert Hall, designed by Frank Gehry, has become a landmark for the city, as has The Broad. Rich people and philanthropists tend to like high-class culture, and this is the hub that shows where the money is. My own workplace is trying to up its profile and contribute to the redevelopment of the area by announcing a campus expansion project with public spaces and music venues to serve the community, also designed by Frank Gehry. Of course, it’s going to cost a lot of money.

Force 5: Luxury Developments

The Bloc LA
A street view of The Bloc, a 2015 development with restaurants, fitness, and retail stores attached to the 7th/Metro metro station

DTLA has historically been a drive-in, drive-out part of the city filled with workers during the day and empty at night, since no one wanted to live in the derelict part of town. In the last 10 years, the Los Angeles City Council passed a measure that made it easier for developers to convert old, vacant office and commercial buildings into renovated luxury apartment complexes. As a result, more people are starting to live in downtown, and development is continuing to build around those complexes. Hip restaurants, coffee shops, and other new businesses are now standard in those parts of town, creating a relatively safe bubble for new residents.

There are so many forces that affect DTLA that it is hard to separate them from each other and pick them out. They are all interrelated in creating the diverse, disorderly mish-mash of land that exists today as downtown Los Angeles.

Part 3: Forces, Combined

Arts Institutions and Development

Are artists to blame for gentrification? Probably not. But gentrified areas are more likely to have art, and you can see that in DTLA where new developments and arts institutions are clustered in the same area.

Public Transit and Development


At the same time, most new developments are clustered in the South Park neighborhoods at the lower left hand corner of the map, along the path of the Expo Line light rail, depicted in light blue. There is a common pattern in Los Angeles where new metro stops spur development and drive up the price of land and rent in the immediate area.

Avoidance of Historic Districts and Skid Row


It’s pretty obvious that new developments would avoid the “undesirable” parts of downtown, but it’s even clearer when you can see it laid out like this. There may be zoning or historic preservation issues involved, but it’s more likely that developments cluster around each other because it’s more profitable to do so.

Everything, All at Once


DTLA is booming, there’s no question about it. What will it look like in the next 5-10 years? Will city planners and developers do anything to alleviate the housing crisis, or will DTLA become even more segregated in its dichotomy of nice/not-nice areas? Only time will tell.

View the .pdf

Project 2: Joseph Hornig

Final Map

Final Map UCI Hornig test

Isolated map:

Isolated Final Map UCI Hornig test

Download PDF

Final Map Drafts

(legends still to come)

Final Map Hornig Draft 1 Final Map Hornig Draft 2

Revised Forces

After some reflection, I felt I took too much of a marco focus with my initial forces: I identified a lot of green space, a lot of dorms, a lot of anteater landmarks, etc. But it was the geometry of the campus’ layout that I found the most interesting. This was the area of campus that I wanted to explore as I continued down this project.

So I did another round of observations, and I realized that despite having this large, beautiful park right in the middle of campus, the heart of campus activity is actually along the circular path surrounding the park. Students walk through the park, but they don’t really spend time there. So I wanted to identify the forces that were causing Ring Road to be the hub of student activity.

Force #1: Buildings

UCI Buildings

Force #2: Foot Traffic and Seating

UCI Seating UCI Map of Foot Traffic and Seating

Force #3: Food (and most importantly, coffee!)

UCI Food and Coffee UCI Map Food

Force #4: Bike Racks

UCI Bike Racks Map of UCI Bike Racks

Force #5: Flyers and Announcements

Flyers at UCI Map of Flyers at UCI

Previous Forces

In total, UCI’s campus spans more than 1,500 acres, but I’ve been focusing on the main area circling out from Aldrich Park. The primary forces I’ve observed are geometry in the campus’ circular layout; the abundance of green space, anteater landmarks, and student housing; and the heavy foot traffic among the 30,000+ students.

Geometry

UCI Campus - Geometry

UCI’s campus has a unique circular layout. Almost every undergraduate school is placed along Ring Road, a 1.4 mile circle surrounding Aldrich Park. Despite being a large university, UCI’s campus feels small: the circular layout makes it easy for one to get around.

UCI Map Geometry

Green Space

Aldrich Park

In southern California, it’s rare to see a place as green as UCI. There are more than 100,000 trees and shrubs throughout campus and in the heart of campus is Aldrich Park, a lush 19-acre oasis. On the north side of campus is a botanical garden and arboretum.

UCI Map Vegetation

Landmarks

UCI Landmarks

UCI students clearly have a lot of school pride (you see a lot of UCI apparel walking around) and images of Peter the Anteater (the school’s mascot) are everywhere. There are two anteater statues on benches by the Student Centers that students often take selfies with, a giant anteater statue by the Bren Events Center, and an anteater on the water tower.

UCI Map Landmarks

Housing

UCI Dorms

There are two main freshman residence halls just off of Ring Road: Mesa Court, which recently unveiled brand new towers, and Middle Earth, where brand new towers are currently under construction. In addition, there is a smaller housing community with less students by the science library. There  are also a host of privately owned and operated apartment communities just across the street.

UCI Map Housing

Student Foot Traffic

UCI Students

There is a lot of foot traffic on campus, with the most densely populated areas being the Student Center plaza and the main academic plazas off of Ring Road. There is also a lot of congestion outside of Aldrich Hall where many student clubs and organizations table to raise money by selling food and boba. While cutting through Aldrich Park provides shorter routes for getting from point A to point B, it seems that most students simply walk along Ring Road to get to where they’re going.

UCI Map Ethnicities

Project 2: Q


PART 1: OBSERVATIONS

Five forces observed around Dolores park, a large and popular public park in the Mission neighborhood of San Francisco. Note I had already planned to do this site before seeing Alex R. similarly post about his part neighborhood in the city. Great minds think alike!

Fog – specifically Karl the Fog


San Francisco regularly has heavy fog. In certain neighborhoods of the city it can be what one commonly wakes up to. The fog can be so persistent that social media elites have given it a name: Karl the Fog. This embodiment of SF fog has over 300k followers on Twitter! One can get a feel for the made up snarky yet funny personality from some of it’s tweets:

  • “There’s a city down there somewhere.” – link
  • “It tastes like Everlane [shirt] tops and bros talking about bitcoin.” – link

Dolores fortunately has a summit, Twin Peaks, to the west which helps dissipate the fog but never completely. As a result, even on a “sunny” day the fog is intermittent over Dolores park. Seen are two photos taken 15 minutes apart. Those from out of town and not aware seem to never know if they should stay in the park and or pack up due to sudden chill factor. As a force, the fog commonly has SF residents thinking about temperature drops which results in a tendency to pack a fleece or jacket.

Queues

Picture of boba queue
Boba queue
Picture of grocery store queue
Grocery store queue


This city is a mecca of good food. The entire Mission neighborhood is just about 1.5 square miles yet hosts five Michelin star restaurants. Filling in spots in between are another 70+ restaurants ranked very highly on Yelp and Foursquare. Good food on top of close proximity to tech companies that dot the peninsula south of the city results in a regular queing up in long lines. Whether it be for groceries, refreshments, or fast-casual cuisine, you can expect a line of waiting. Pictured are just a few of the shorter (yes, shorter) lines I observed while out and about for this assignment. The first line is for boba while the second was for grocery store checkout. Due to their regular occurrence, many have sought the use of technology to help bypass queues altogether. This has fueled online reservation systems as well as numerous food delivery startups including Postmates, DoorDash, and Instacart. For a low-tech solution, people sometimes force themselves to attend popular restaurants at off hours for hopefully shorter wait times.

Construction

Over time San Francisco has had large net gains in new citizens (link). This combined with lack of insufficient development has resulted in a housing shortage. While high rise developments dot the city, they are far behind in keeping pace with residential growth and pent up demand. For those able to afford a home, a large amount of houses are decades old and require modernization upgrades and fixes. This impacts the city in a variety of ways including regular appearance of cranes dotting the skyline, building facades covered in scaffolding, and building permits reserving street parking spots for construction crews. Less thought about is the increase of traffic and noise pollution caused by large trucks hauling construction equipment throughout the city. The cranes dotting the skyline were too far away so pictured instead is a temporary construction office that has taken up multiple parking spots along with part of the street.

Cars

The force and impact of cars should be no stranger to anyone. Given that automobiles have become widely adopted, cities are built to accommodate them as a primary modes of transportation. Cars spend the majority of time idle and require space on streets or in garages. It is a given that all streets must offer some form of street parking and any housing projects must generally plan for some parking spots. One could argue it is a factor in why public transportation has not been vastly expanded in San Francisco despite many residents forgoing owning a car due to limited parking availability. Additionally cyclists and skaters are impacted by becoming “secondary citizens” to cars. They often must ride with 35 mph traffic on the left and parked cars on the right where doors can swing open at any moment. Most signage and signals don’t have affordances to let drivers clearly see cyclists. Cars as the primary mode of transportation have greatly shaped the Mission neighborhood as there are very few spots where a car can’t go. Pictured is a street near Dolores park with cars lining both sides as well as a car that is clearly parked past the curb.

Recreation

Photo depicting parents of newborns and young kids
Parents of newborns and young kids
Photo depicting two birthdays in the park
Two birthdays in the park


This force was a fun, creative one to think of. I posit that an innate desire to be social is part of being a human. We are social creatures and this unseen force of connectedness is what causes us to want to enjoy the company of others. It is what results in creating notions of community and social events and tends to hold regardless of one’s stage in life. Events and public outdoor spaces such as Dolores Park can help to reinforce these notions. While at Dolores, I snapped photos showing various examples of humans gathering including a gathering of parents with newborns and young kids, two birthday celebrations (note the balloon and birthday hat), and presumably two friends enjoying their leisurely day with help from a proprietor of moonshine.

Photo depicting a potential sale of moonshine
A potential sale of moonshine


PART 2: MAPPING THE 5 FORCES

Karl the fog

I’m having difficulty thinking of how to show a temporal, fleeting thing such as fog. Here I’ve decided to have fun and embody it as a character overlooking a part of San Francisco.


Queues

Below highlights popular destinations that receive high foot traffic and whose establishments are known for regularly having lines one must wait in to order, pay, be seated, etc.

Construction

Below marks closed or partly closed streets as a result of current construction.

Cars

This was difficult to map as I wanted to do something different beyond just showing where cars park (which would be every inch of every street). I luckily discovered some historical San Francisco city data showing areas around my neighborhood where drivers tend to exceed the speed limit. Mapping this can help warn pedestrians to be more careful around these areas – thus showing the “force” cars have on human interaction and safety.

Recreation

Below shows the location where I observed the moonshine vendor.

PART 3: FINAL BASE MAP

I wanted the final combined base map to weave a story and so intentionally left out two of my forces – construction and recreation. As noted below I continued the theme of embodying fog as a character – in this case “escaping” the valley and peaks to the west and descending upon my San Francisco neighborhood. As it descends, the map’s title advises locals to head for the busy shops and restaurants but to watch out for areas where cars are historically known to speed excessively. Higher fidelity PDF file here.


After reviewing instructions for exercise 3.1.2, I decided to add back in the force of recreation (below). This update depicts recreation as a vendor selling local moonshine, a semi-regular occurrence in the park and something I noticed during my observations. I’ve also updated the description or “legend” in the top right of the map. This update will allow me to tell a better story that I have envisioned for our upcoming exercise 3.1.2. A higher fidelity PDF file of the updated map here.


– By Q aka Alex Duong

Project 2: Liliana Hernandez

Part three

Updated Map:

Original Map:

A brief annotation on this mapping of the Spectrum: This final map came to life through my original observations, my general mapping of each individual force, the wonderful feedback from my classmates, and some extra research into the world of the Irvine Spectrum Center. With the discussion and comments on my post, I found that while I had identified some prominent forces at this outdoor mall, there were deeper intricacies that could be uncovered with a little more research. Therefore, I chose to categorize the commerce by level of expense, I distinguished between the larger informational kiosks at the entrances of the Spectrum versus the smaller kiosks that served more as just navigational aids. Finally, I expanded my perception of the all the kids and child-friendly activities available to include that the Spectrum is really just overall a family-friendly environment; this is supported by the fact that a lot of the available seating frames that child play areas, giving parents and guardians a comfortable area from which to look over their children. Inspired by this insight, I grouped both my seating and kids play forces under the Family Friendly category. I also noticed that while the shops are pretty well spread out in terms of how expensive they are, the main area of the Spectrum where they have the characteristic ferris wheel has the larger and more expensive stores beckoning shoppers to enter their doors

Part two

Part one

Commerce : The range of stores and restaurants found at the Irvine Spectrum Center affect the environment because they suggest that regular shoppers may have a certain level of income in order to be shopping at may of the stores found. Also, it was interesting to see how what the people who entered the stores were wearing while shopping reflected the sort of items typical of the store they entered.

Window Displays: The store fronts had the affect of either making people stop to look at what was shown on the mannequins, or even go so far as to entice them to enter the store. Every corridor was lined with tall windows so everyone could easily look inside and see what that store had to offer.

Kiosks: Getting around the Irvine Spectrum Center could be a little confusing, so many people tended to stop at the informational kiosk to pick up a map or stare at the full listing available stores and restaurants on the kiosk. I thought it was efficient how the kiosks had both the detailed information around eye level, but at the top had arrows pointing towards the upcoming stores. 

Seating: Essentially everywhere you walk around the Spectrum, there is available seating. Groups of chairs out like these in the picture below, or tables, or even just benches scattered around. People would congregate here, take a quick break from their shopping, etc.

Kid Friendly: I was a little surprised with the amount of children there were around, and I realized that the Spectrum is a sort of haven for the children who visit it. There are so many areas to play, everything from the giant ferris wheel in the center, the carousel shown to the right, and even the misty water fountains located throughout the . So many children laughed and squealed with the fun they had, waiting for the mist to turn on again and excitedly getting their parent’s attention.

Project 2: Serena

Part 1: Observations

Don Edwards San Francisco Bay National Wildlife Refuge is fascinating, both for its natural beauty and its amazing history of reclamation and renewal. Founded in 1974 to reclaim Bay Area wetlands from industrialization, this was the first urban National Wildlife Refuge. Its 30,000 acres are now home to more than 280 species of birds, as well as mammals, reptiles, amphibians, fish, insects, invertebrates, and–of course–human visitors.

My stretch of the refuge is nestled alongside a major highway, so there’s always a hum of traffic in the distance, blending with the more immediate sounds of shoes crunching on gravel, birds chirping, and wind rustling through the leaves. Airplanes landing at SFO cross overhead every 5-10 minutes, but the wildlife and visitors don’t seem to mind. You get the sense that everyone is just glad to be there, in a rescued space whose history was not always certain.

Corridors & Boundaries
Highways and roads serve as boundaries around the refuge on three sides, with the bay along the fourth side. Several types of corridors traverse this space, including footpaths, bridges, waterways, and roads. There are also some informal corridors, where shortcuts have been created between footpaths.

Transformations
The refuge is full of evidence of transformations, from rusting industrial equipment long abandoned and empty hunting shacks, to visible efforts at regrowth and reintroduction of native species. In one of the photos above, you can see the use of bamboo supports to encourage plant regrowth.

Wild Space
Although the reclamation of this space was relatively recent and it is still undergoing regrowth and transformation, it is already full of wild spaces, large and small. Footpaths meander around these spaces, with a lot of care given to leave the ecosystem intact with enough open space for new plant growth and animal habitats. In just one visit, I saw several enormous flocks of birds overhead, so large that you could hear the whoosh of their wings as they flew by, changing directions with the wind. Additional flocks were hanging out on the bay.

I also saw smaller birds perched in bushes chattering to each other, and a few rustling around while they foraged along the forest floor. Squirrels, lizards, insects, herons, and egrets all crossed my path. Toward the hills, there are large, established trees as well as smaller, recently planted ones. Closer to the bay, the marshland is covered with short, hardy vegetation– some brown from the sun and some green with new growth. Even though this is a popular park, it is possible to follow a path in one direction and be completely alone in nature the entire time, with no other humans in sight.

Water Flow
Because a large portion of the wildlife refuge is wetlands, water flow is a crucial component of the ecosystem. Some areas, like the salt ponds on the upper left, contain relatively still water and are home to thriving bacteria and insect colonies, as well as tadpoles and small fish. Larger waterways have a faster flow and are occasionally traversed by boats, which leave the wake shown above. I also spotted some foam floating on the water but was not able to identify it. It seemed to be produced by a process at the nearby building. I watched it disperse, floating with the current and blowing in the wind, before gradually disintegrating.


Part 2: Force Maps

map of Don Edwards Wildlife Refuge, showing corridors
Corridors through land, water, and air.
map of Don Edwards Wildlife Refuge, showing boundaries
Since this area is primarily wetlands, boundaries between land and water change with the tides and seasons.
map of Don Edwards Wildlife Refuge, showing transformations
This area has undergone many transformations, from wild space to industrial activity, and now back to wild space again. Some of the buildings on the map are aimed at conservation education, and others are abandoned vestiges of previous uses.
map of Don Edwards Wildlife Refuge, showing wild space
The wild space is a mix of trees and low-lying wetland vegetation.
map of Don Edwards Wildlife Refuge, showing water flow
Water flows in from the bay, down streams, and within wetland areas.


Part 3: Combined Map
Motion & Stillness

combined map depicting areas of motion and stillness

PDF here.

For my combined map, I decided to ditch some of my less compelling forces in order to explore the concept of “motion and stillness” with a little more richness and depth. I chose to indicate motion with a color scale, and I drew my inspiration from the ocean. Just as calm water is dark blue, and rough water is white, my areas of stillness are dark blue and areas of motion are white.

Some types of ongoing motion–like waves, wind, and traffic speeding by–fade into the background of the map, just as they fade into the background when you experience this environment in real life. Other elements of intermittent motion–like flocks of birds, airplanes crossing overhead, and joggers–punctuate the landscape as a reminder that life and movement are all around. Not all life is depicted with motion; floating flocks of birds, wading storks, and sitting people appear in dark blue as they blend into their environment.

If someone handed me this map when I arrived at the site, I would probably use it to locate areas of stillness, where I could sit and watch everything rush by me.

Part 4: Final Map

final map of the wildlife refuge, depicting motion and stillness

PDF here.

Project 2: Daniel Lau

Intuitive Campus

Intuitive Campus

Intuitive is a medical device company that creates surgical robots and robotic diagnostic tools. The company has around five thousand employees, two thousand of which work in Sunnyvale, CA. Since so many people work in Sunnyvale, the campus has sprawled out across Kifer Road. All employees are spread out across 8 buildings, with more buildings and parking lots currently being built. The campus spans 1.2 miles from end to end and this image helps in illustrating that.

Intuitive Main

MAIN HEADQUARTERS

As noted earlier, Intuitive has 5,000 full time employees worldwide. Main hiring flows through the headquarters. Important C-level employees, Finance, and HR reside in this building. They are a major force in creating employment opportunities in this region.

CONGESTION

The speed limit at Intuitive’s parking lots are 15MPH. This roundabout that shows which way is the correct orientation of it has always confounded drivers at the company. Although the speed limit is 15MPH, people drive even slower at this roundabout as it is also an intersection where people walk between buildings. Congestion is a force within this lot.

Intuitive Roundabout

Intuitive Parking

PARKING

The amount of parking spaces almost mimic the amount of land Intuitive owns. For now, all parking is flat on one level. This has caused parking shortages at several buildings. Intuitive is currently building a new parking structure to accomodate additional buildings and employees.

OUTDOOR PATIO

This space is utilized for outdoor seating. It’s also an area where seems to busiest during lunch hours. This illustrates the human habitation force as only employees utilize it during certain hours of the day. These areas are also decorated with manicured trees, bushes, and grass. It is a force that makes people appreciate the “outdoors” while working in grey concrete buildings.

Intuitive Outdoor Patio


Forces

Click maps for enlarged & detailed view.

Force: Employment Space

Employment Force

These eight buildings represent the Sunnyvale campus of Intuitive. Since we are a medical device company, research and development requires a large workforce. Intuitive employs over 5,000 people and a bulk of the workforce works in Sunnyvale. Each building houses a workforce with diverse sections of the company including engineering, manufacturing, shipping, information technology, finance, accounting, human resources, etc.

Force: Manicured Space

Manicured Space Force

The area is filled with manicured bushes, trees, and grass. It takes up some space, but creates some natural beauty in an area filled with concrete. Trees provide cover for some cars in the parking lot, which is especially nice for hot summer days. The spots closer to these trees are normally the most coveted spots in the parking lot due to this fact. Intuitive has a company park where events are held. This is the largest density of trees in the area.

Force: Human Habitation (Recreation)

Human Habitation Force

Any opportunity for employees to be outside is a good thing. In this four building layout in the middle of the map, there are two main areas where people can eat outdoors. Patio seats, picnic tables, and grassy areas allow employees to eat outdoors. During lunch, these areas are incredibly busy and utilized in a meaningful way. You can sometimes hear people talk about work as the outdoors gives people a different context. At Intuitive’s park, a baseball field, running trails, and event space are utilized for special company events and engagements. Note: only a few buildings have outdoor habitation space for eating outdoors.

Force: Congestion

Congestion Force

Most of the land use in this area is utilized on buildings and parking. Congestion becomes an issue as people start trickling into work. There are several roundabouts in the campus that cause cars to drive more carefully. The speed limit is 15mph in the parking lot. Cars drive in single file and the central area with the roundabouts cause the most amount of morning parking lot congestion.

Force: Parking

Parking Force

Parking is a complex force in this company. The amount of employees that commute to Sunnyvale outnumber the number of parking spots. Since the parking spots are on a single layer and there is only a limited amount of land, this parking lot fills up quickly. Recently, there has been valet parking added to employee benefits in order to alleviate the parking congestion. It’s also forced a few employees to find other ways to commute to work, such as public transit and ride sharing. There’s also parking for electric vehicles that is highly sought after. As more of the workforce is environmentally conscious, the purchase of plug-in electric vehicles has increased. The parking near the plug-in stations has gotten increasingly congested.

All Forces

All Forces Combined

Layering the maps show the campus and all of the forces that hold this campus together. Forces work in harmony to create a campus with a large footprint. Intuitive’s campus easily spans over a mile from end to end. It’s diverse workforce commutes from all across the Bay Area.

Download Full PDF

Project 2, Mappings: Alex Rosales (Patricia’s Green, Hayes Valley)

Patricia's Green in San Francisco's Hayes Valley neighborhood
Patricia’s Green in San Francisco’s Hayes Valley neighborhood

Part 1

I live in Hayes Valley which is a popular, revitalized neighborhood contained in the corner of the larger Western Addition neighborhood in San Francisco. Its central point is Patricia’s Green, a small park and “town square”. On the surface this area is ideal– the park features unique art structures, people converse over artisan coffee, and shoppers and diners shuffle in and out of fancy restaurants and exclusive boutiques. However, this neighborhood is at the center of many clashing forces that differ from the picturesque Patricia’s Green.

In the shadow of the freeway, Hayes Valley in 1980 was a different place than it is today.
In the shadow of the freeway, Hayes Valley in 1980 was a different place than it is today. Photo by David Glass.

Thirty years ago, U.S. Highway 101 ran straight through the neighborhood (not yet named Hayes Valley), which was a seedy area with drugs, prostitution, and gang activity. It also served as a division between the predominantly black Western Addition neighborhood and downtown. In 1989, the Loma Prieta earthquake shook the Bay Area, and here in Hayes Valley, the freeway incurred structural damage eventually leading to its removal.

Over the next 30 years, gentrification took over the area where the freeway used to run. It has been accelerated recently due to its location in the city, the growth of the technology industry, and the development of the neighborhood as a prime dining and shopping location. Despite this, some vestiges of the old Hayes Valley still exist, and it is often times striking and sad to see the the juxtaposition of young and old, rich and poor, manufactured beauty and urban blight.

In the next section, I will discuss five forces shaping the gentrification of Hayes Valley. Many of these forces affect the original lower income residents and have caused displacement of the homeless in the area.

Terrain

The hills are extremely steep on the western end of Hayes Valley going up to Alamo Square

The first force affecting the area around Patricia’s Green is the terrain. While this has been around pre-gentrification, the neighborhood has manifested differently around the hills. As one may guess, Hayes Valley sits at the foot of a few hills. To the west is a large hill that leads up to Alamo Square– a quaint park where the Painted Ladies from the Full House opening are located. The hills are more residential and quiet, while the flatlands are home to more of an urban landscape. These flatter areas are the main stage for the clash of gentrification.

Here one will find the stark contrast between rich and poor. The hills are where the more well-off residents had built their housing historically. In the 1950s and 60s when the freeway was built, public housing was built on flatland in the shadow of the overpass. These buildings still exist, and many of the original residents still live there.

Some may also argue that the homeless, often too weak to walk up the hills find themselves settling on flatter ground. I’m not so sure about this, but the flattest, easternmost point of Hayes Valley lies closest to the Civic Center and Tenderloin neighborhoods, known for their tolerance for the homeless and access to social services.

Traffic

U.S. Highway 101 was a main driver in creating the seedy atmosphere of pre-gentrification Hayes Valley. Here traffic flowed above the neighborhood, which was merely passed over by travelers.

The Central Freeway snaking through Hayes Valley prior to the 1989 Lomo Prieta earthquake.
The Central Freeway snaking through Hayes Valley prior to the 1989 Lomo Prieta earthquake. Photo by the San Francisco Chronicle.

When the freeway was demolished, the highway had to flow directly into Octavia Blvd. (the main artery into Hayes Valley). Any traveler hoping to go west in San Francisco must exit here and the north/south running Octavia would “T” westward, flowing onto Fell St. (this major intersection is at the south end of Patricia’s Green). Anybody coming from the west takes Oak St. which feeds in Octavia. As a result, there is a lot of traffic on Octavia, Fell, and Oak. Since it sits at this intersection, Patricia’s Green is the epicenter for people traveling to and through Hayes Valley.

One may say that this location has also become desirable for commuters working in the South Bay, as Octavia St. flows into the 101. I’ll touch upon this later in the force of the “Technology Industry”.

Technology Industry

The Twitter Building is adjacent to Hayes Valley
The Twitter Building is adjacent to Hayes Valley.

While tech has traditionally been associated with Silicon Valley to the south of the city, over the years San Francisco has become more ubiquitous with the technology industry. On the southeastern most border of Hayes Valley, there are two buildings on Market Street that house the headquarters for companies such as Twitter, Square, Uber, Thumbtack, and Nerdwallet. As mentioned previously, Hayes Valley has also served as an easy way to access the freeway down the peninsula. Companies such as Google have created bussing programs to provide free transportation down to their campuses, while still allowing employees to live in the city.

Affordable housing on the edge of Hayes Valley

As a result, many folks in the technology industry have chosen to reside in Hayes Valley. Many argue this influx of affluent young professionals has made the place extremely unaffordable to live. However, there are still pockets of affordable housing buildings and rent controlled apartments to the north. This part of Hayes Valley is more representative of the Western Addition neighborhood, which was the historically black neighborhood in the city. The effects of the tech industry have not seeped into this area yet, but new condos filled with techies loom just across Gough and Fulton Streets.

Dining, Shopping, and Entertainment Establishments

Over the years, Hayes Valley has become one of the most popular areas for diners and drinkers. While you would be hard pressed to find an old school restaurant or dive bar catering to the original Hayes Valley and Western Addition natives, there are a ton of high-end restaurants, specialty ice cream shops, and fancy cocktail/wine bars.

The Civic Center area borders the eastern end of Hayes Valley. Dining establishments in Hayes Valley would cater to government workers or patrons of the arts from Civic Center.

Establishments catering toward elites have been around for awhile here, despite the neighborhood’s previous reputation. This is due to the easternmost border– the Civic Center neighborhood. Government buildings, museums, and fine-arts theaters cluster to form a beautiful, Beau-Arts inspired campus. Businesses began to cater to the people who worked here or saw shows. For instance, some old establishments such as the Hayes Street Grill attract people attending an opera, ballet, symphony, or jazz concert.

The Fatted Calf is an artisan butcher shop next door to my house.

To capitalize on business, newer restaurants started to pop up. Over the years, more and more have set their stake in Hayes Valley, which hosts the largest concentration of acclaimed establishments in the city. Now trendy restaurants and bars cater to younger folks such as the pseudo-fast casual Souvla, homemade pasta joint A Mano, and Bavarian/Industrial inspired Biergarten. There are also four artisan ice cream shops within a one block radius from Patricia’s Green. If this isn’t illustrative of the neighborhood, I don’t know what is.

In addition to restaurants and bars, upscale boutiques line Hayes Street across three blocks, Patricia’s Green at the center. For those looking to escape the hustle and bustle of Union Square’s traditional large retailers, Hayes Valley serves as a more enjoyable leisurely shopping experience for those with large enough wallets.

Hayes Valley Neighborhood Association Influence

A Hayes Valley Neighborhood Association meeting sign

This force is largely unseen, but it plays a part in nearly many of the forces previously mentioned. The Hayes Valley Neighborhood Association is an organization that works with developers, planners, and other parties to create the “ideal” neighborhood for its residents. The group has lauded themselves as one of inclusivity, recognizing the forces of gentrification. However, I am skeptical that they are doing much or can do much to make life better for all.

Paint splatters from a homeless man named John, who lives and creates art in the neighborhood.

To demonstrate what I mean, I cite its treatment of the homeless population here. On a positive note, HVNA has made it public that they want to promote a culture where rather than kicking the homeless off of the boutique and restaurant lined streets, they try to accommodate their needs. One homeless man with mental illness named John frequently walks into businesses. One merchant always gives him coffee and lets him sit outside of their business where he makes beautiful paintings and sells them to people outside. I am not sure if this is really a result of HVNA’s mission or simply the kindness of shop owners.

However, the association also promotes the safety of their neighborhood, getting increased police presence to patrol the area. I once saw a black man who was simply speaking to himself loudly, handcuffed in the middle of Patricia’s Green. It became apparent that a parkgoer felt uncomfortable and called the police, who were just around the corner. As there was no illegal activity, they let him go, but the man was extremely agitated, complaining about what the neighborhood had become. While this is an isolated incident, the fact that someone felt like they can call the cops on a man who appeared out of place, and that the police response was to take him down violently still burns an image in my mind.

In its attempts to create an improved version of their neighborhood, I wonder who the HVNA favors. In my opinion, it feels obligated to include inclusivity in its mission, but the changes over the past year under the association have allowed for more condos, upscale restaurants and shops, and open park spaces, which transformed the neighborhood drastically in favor of full gentrification.

Conclusion

I have to admit that I initially moved to an apartment near Patricia’s Green because of how delightful it seemed on the surface. However, I recognize the pressure that these forces place upon those who are less fortunate. Gentrification is evident across San Francisco, but in this landlocked neighborhood in one of the busiest areas of the city, it is even more drastic. I one day hope to move to a neighborhood that is truly more inclusive.


Part 2

Terrain

Yellow represents intense elevation.

Traffic and Tech Industry’s transportation

The main thoroughfares going through Hayes Valley are also integral routes for buses that transport tech employees to their headquarters in Silicon Valley.

Dining, Shopping, and Entertainment Establishments + Hayes Valley Neighborhood Association Influence

Orange establishments represent restaurants, retail stores, and entertainment venues. Gray establishments represents residences. Blue establishments also represent residences but more specifically indicate public housing.


Part 3/Final

Hayes Valley

I evolved my forces over time to be better represented on the map. “Hayes Valley Neighborhood Association Influence” was a little nebulous, but ultimately I created buckets to better show the disparity in housing in this area. Further, “Traffic” includes “Tech Industry” influence as many of these roads serve as routes to Silicon Valley.

Click here for a higher resolution version hosted on Google Drive.

Project 2 : Tiffany Tam

Part 3: Final Map

FULL RES PDF

I decided to keep four of my five forces for my final map (Store Fronts, Bicyclists, Dirty Streets and Street Parking). After looking at feedback and attending office hours, I decided to focus on the relationship between people and my five forces. The map uses gradation to show general activity and frequency of that activity based on some observations I have made. For example,  the darkest green dotted line represents the most used path for bicyclists and the lightest green is the least used path. Although there are bike lanes clearly marked on many streets, I felt it was important to show which ones got used the most. I noticed bicycles preferred one street over another. For Dirty Streets, I decided to follow Alex’s recommendation and showed which streets tend to have the most trash. You will notice that the side with the most trash also has the least bicyclists. For the force Store Fronts I used shades of blue to represent the most viewed store fronts to the least based on street activity and store. I determined this based on what the store is and whether or not they had store front displays. For example, restaurants tended to have less people stopping to look at their store fronts relative to retail stores. Lastly, for Street Parking I decided to show what streets had the most parked vehicles instead of street meters and the number of hours you’re allowed to park. I realized that a lot of the parking in the smaller blocks were either 2 hours or permit parking which meant that people could park for longer periods of time. I noticed that permit parking areas were always filled with vehicles, thus making the meters and street parking signs pretty obsolete. I also approached this with the idea that I wanted some of these features added into tourist maps or google maps. I would love it if google maps told me what area is the best to park in or which bike lanes to take for the best ride.


PROJECT 2: PART 2

UPDATE: Based on feedback and newly found information, I decided to update my map of the 5 spacial forces.

FORCE 1: WINDOW DISPLAYS

FORCE 2: STREET METERS

FORCE 3: DIRTY STREETS

FORCE 4: BICYCLE LANES

FORCE 5: SUNSHINE


PART 1: SPATIAL FORCES

Window displays: Window displays like this  statue are possible forces because it stops pedestrians in their tracks and catches their eye. People I observed would stop, point and some even grabbed their friend to pull them back to look at it. Some people enter the stores once they look through the windows at the displays.


Street Meters: I think that street meters are forces because it affects where people park and whether or not they park. People who park usually have to get out of their vehicles, walk up close to the meter to read the details of the number of hours they can stay parked and how much it costs. This not only determines whether people come into the space but it also determines the duration.

Dirty Street floors: This is a force, especially in San Francisco, because it determines how people walk. People weave, hop and skip over parts of the floor that are really dirty. It is also common knowledge for locals to watch where you are walking when you are in the city.  It just so happens that there is a vet located on this street so pets are frequently urinating on the streets and people are always avoiding it.

Bicycle Lanes & Bicyclists: San Francisco is a very bike friendly city with bike lanes clearly marked on many of its streets. The street I am observing has a popular bike store so bicyclists and their bikes are frequent visitors. Many bicyclists sped through the bike lanes during my observation and unlike other places I have seen, everyone (motor vehicles and pedestrians) respected the bike lane and kept off of it.

Sunshine: Sunshine is a big force in this area. This street generally gets a lot of sunshine and the amount of sunshine can affect the amount of people who are outside. On this particular day of observation, it was a beautiful 68 degrees and the sun was shining bright. People were sitting outside eating and almost everyone that walked by had their sunglasses on. The sunshine also impacts how people dress and how they feel.