
We can now update warming through 2017.
While the global warming numbers are important, we live on land. We grow our crops on land. The forests and plants that transform our generated CO2 back to Oxygen using photosynthesis are mainly on land. The droughts, wildfires, and some of the floods that cause so much damage to us occur on land, or from nearby Gulf or Caribbean waters.
This graph shows how much more the warming over land has been recently, compared to the warming at the surface of the ocean.
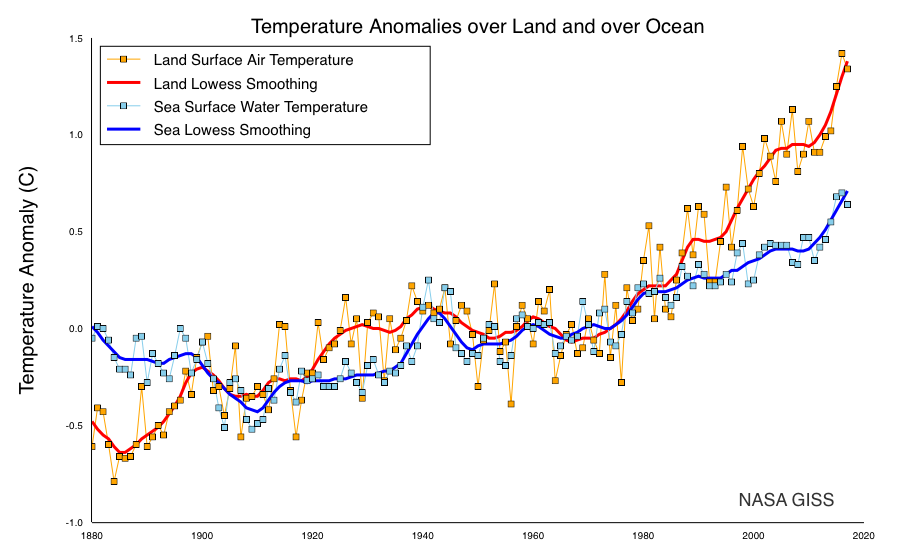
The warming of the land since 1880 has been a full 2.0 degrees C, which is an amazing 3.8 degrees F.
The ocean surface has still warmed 0.7 degrees C, which is 1.26 degrees F.
The ocean warms less because the heat in it mixes down to several thousand feet. 95% of the amount the earth heats up goes into the ocean. The weight of the atmosphere is only equivalent to the weight of the top 30 feet of seawater. So the oceans are a vastly greater heat reservoir. Also, 71% of the earth’s surface is water. The 29% that is land also warms, but earth is a good insulator, and the heat hardly penetrates it.
The Northern Hemisphere has warmed more than the Southern Hemisphere. This is shown graphically.
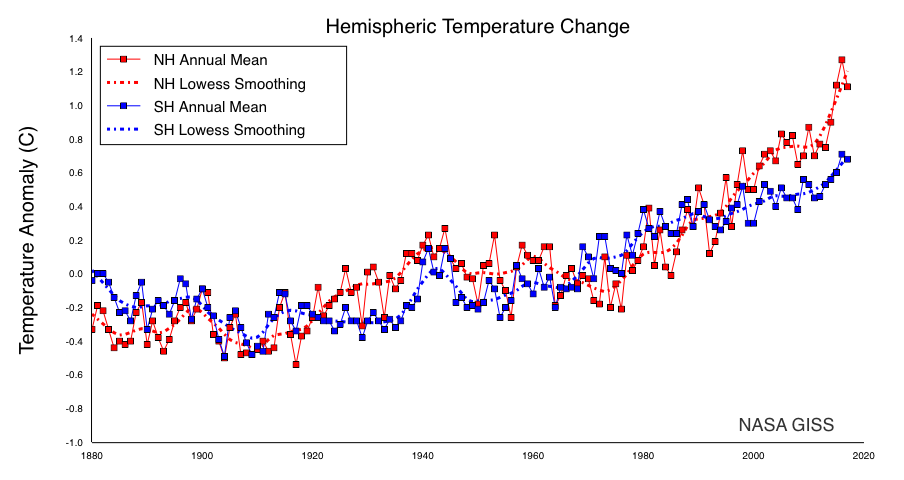
The warming anomaly is approximate from -0.3 to 1.2 degrees C, or 1.5 degrees C, which is 2.7 degrees F. Since this still contains ocean, it is less than the land heating.
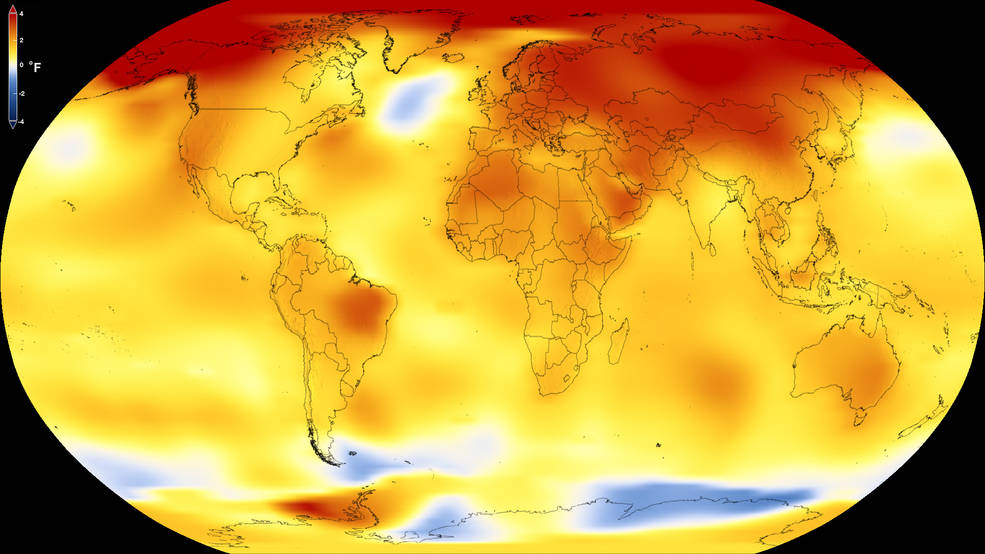
The distribution of surface heating over the earth is shown below. The deep blue to deep red scale is from -4 to +4 degrees F. This correlates with most of the land being in the Northern Hemisphere, but also adds extreme Arctic area warming. Russia and Eastern Europe are highly affected, as well as Alaska and the Yukon of Canada. The US Southwest has gotten mild warming, as has Brazil, Saharan Africa, and Australia.
The United States has a much smaller area than those considered above, so its data has much more fluctuation.
 We’ll just be very conservative and say that this goes roughly from -0.3 to +1.0 degrees C, or 1.3 degrees C or 2.3 degrees F. The US warming has mostly taken place since 1980, which may make us less sensitive to it than other countries.
From the monthly distribution, we see a continuous growth across the year in the global temperatures from 1880 to the present, shown as an evolution from blue to red.

Finally, we include the standard global sea-level temperature curve, which I consider less relevant than the mainly land ones above.
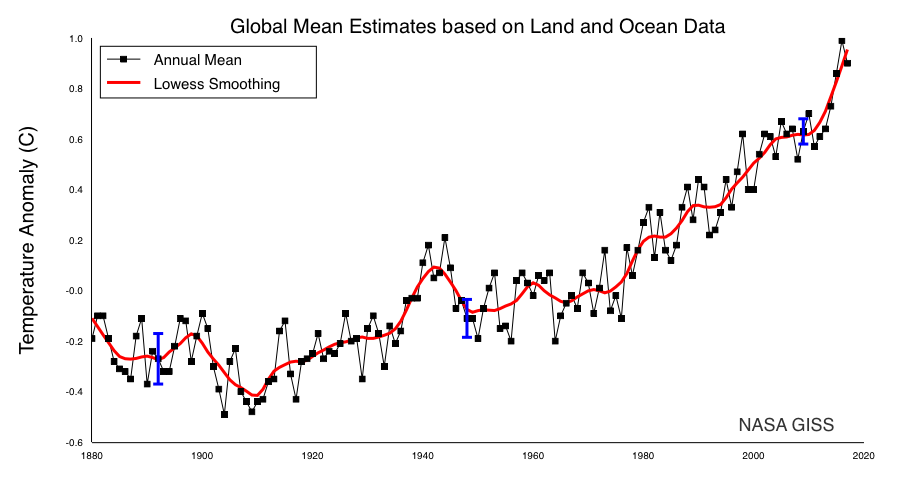
This conservatively shows a growth from -0.25 to 0.9 degrees C or 1.15 degrees C, or 2.07 degrees F since 1880. Again, most of the warming has been since 1980.
We hope that the jump in the last three years is a bit of an upward fluctuation.