We exploit the new availability of climate warming predictions by one degree map boxes to look at the warming by year 2100 of US and World cities. The website is Carbon Brief of the United Kingdom: carbonbrief.org The four standard Emissions Scenarios that they use are: RCP8.5 or Business as Usual; RCP6.0 with a turnover in emissions by 2060; RCP4.5 of cutting emissions in half soon; and RCP2.6 of reducing emissions to zero. The temperatures in the tables are in degrees Fahrenheit for my American readers. Divide by 1.8 for degrees Centigrade.
US CITIES
The first three cities are those where President Trump has towers and homes. The next two are my territory. The above cities are all near the coast and get less warming. Chicago and Denver are inland cities and heat up more. Anchorage is more Arctic which heats up most.
| City | RCP8.5 | RCP6.0 | RCP4.5 | RCP2.6 |
| NYC | 10.1 | 6.6 | 5.1 | 3.3 |
| Wash. DC | 10.0 | 6.5 | 5.1 | 3.1 |
| Miami Bch | 6.7 | 4.3 | 3.4 | 1.8 |
| LA | 7.8 | 4.7 | 3.7 | 2.3 |
| Irvine, CA | 8.8 | 5.5 | 4.5 | 2.9 |
| Chicago | 11.3 | 7.3 | 5.6 | 3.8 |
| Denver | 10.8 | 6.6 | 5.3 | 3.1 |
| Dallas | 9.8 | 6.2 | 4.8 | 3.0 |
| Seattle | 9.3 | 5.6 | 5.0 | 3.0 |
| Anchorage | 12.6 | 8.3 | 7.6 | 3.6 |
WORLD CITIES
Moscow of Russia and Riyadh of Saudi Arabia are the capitols of the other two Countries who with the United States and Kuwait combined to oppose some policies proposed at the Polish Climate Action Meeting. Together, they produce 43% of the world’s oil.
| City | RCP8.5 | RCP6.0 | RCP4.5 | RCP2.6 |
| Moscow | 13.1 | 8.5 | 6.9 | 4.6 |
| Riyadh | 12.4 | 7.3 | 6.2 | 3.6 |
| Beijing | 11.6 | 6.9 | 4.2 | 3.3 |
| New Delhi | 10.2 | 6.2 | 4.9 | 2.6 |
| Paris | 9.3 | 5.7 | 5.0 | 3.0 |
| Cairo | 9.4 | 5.8 | 4.7 | 2.8 |
| Tokyo | 8.5 | 5.3 | 4.1 | 2.2 |
| Rio | 8.0 | 5.1 | 4.0 | 2.3 |
| Mexico Cty | 8.8 | 5.3 | 4.0 | 1.8 |
The technical meaning of RCP8.5 is a scenario of emissions growth or Representative Concentration Pathway. The 8.5 means that by 2100, the increase in radiation above pre-industrial age radiation is 8.5 Watts per square meter. RCP 2.6 is about the radiative forcing present today.
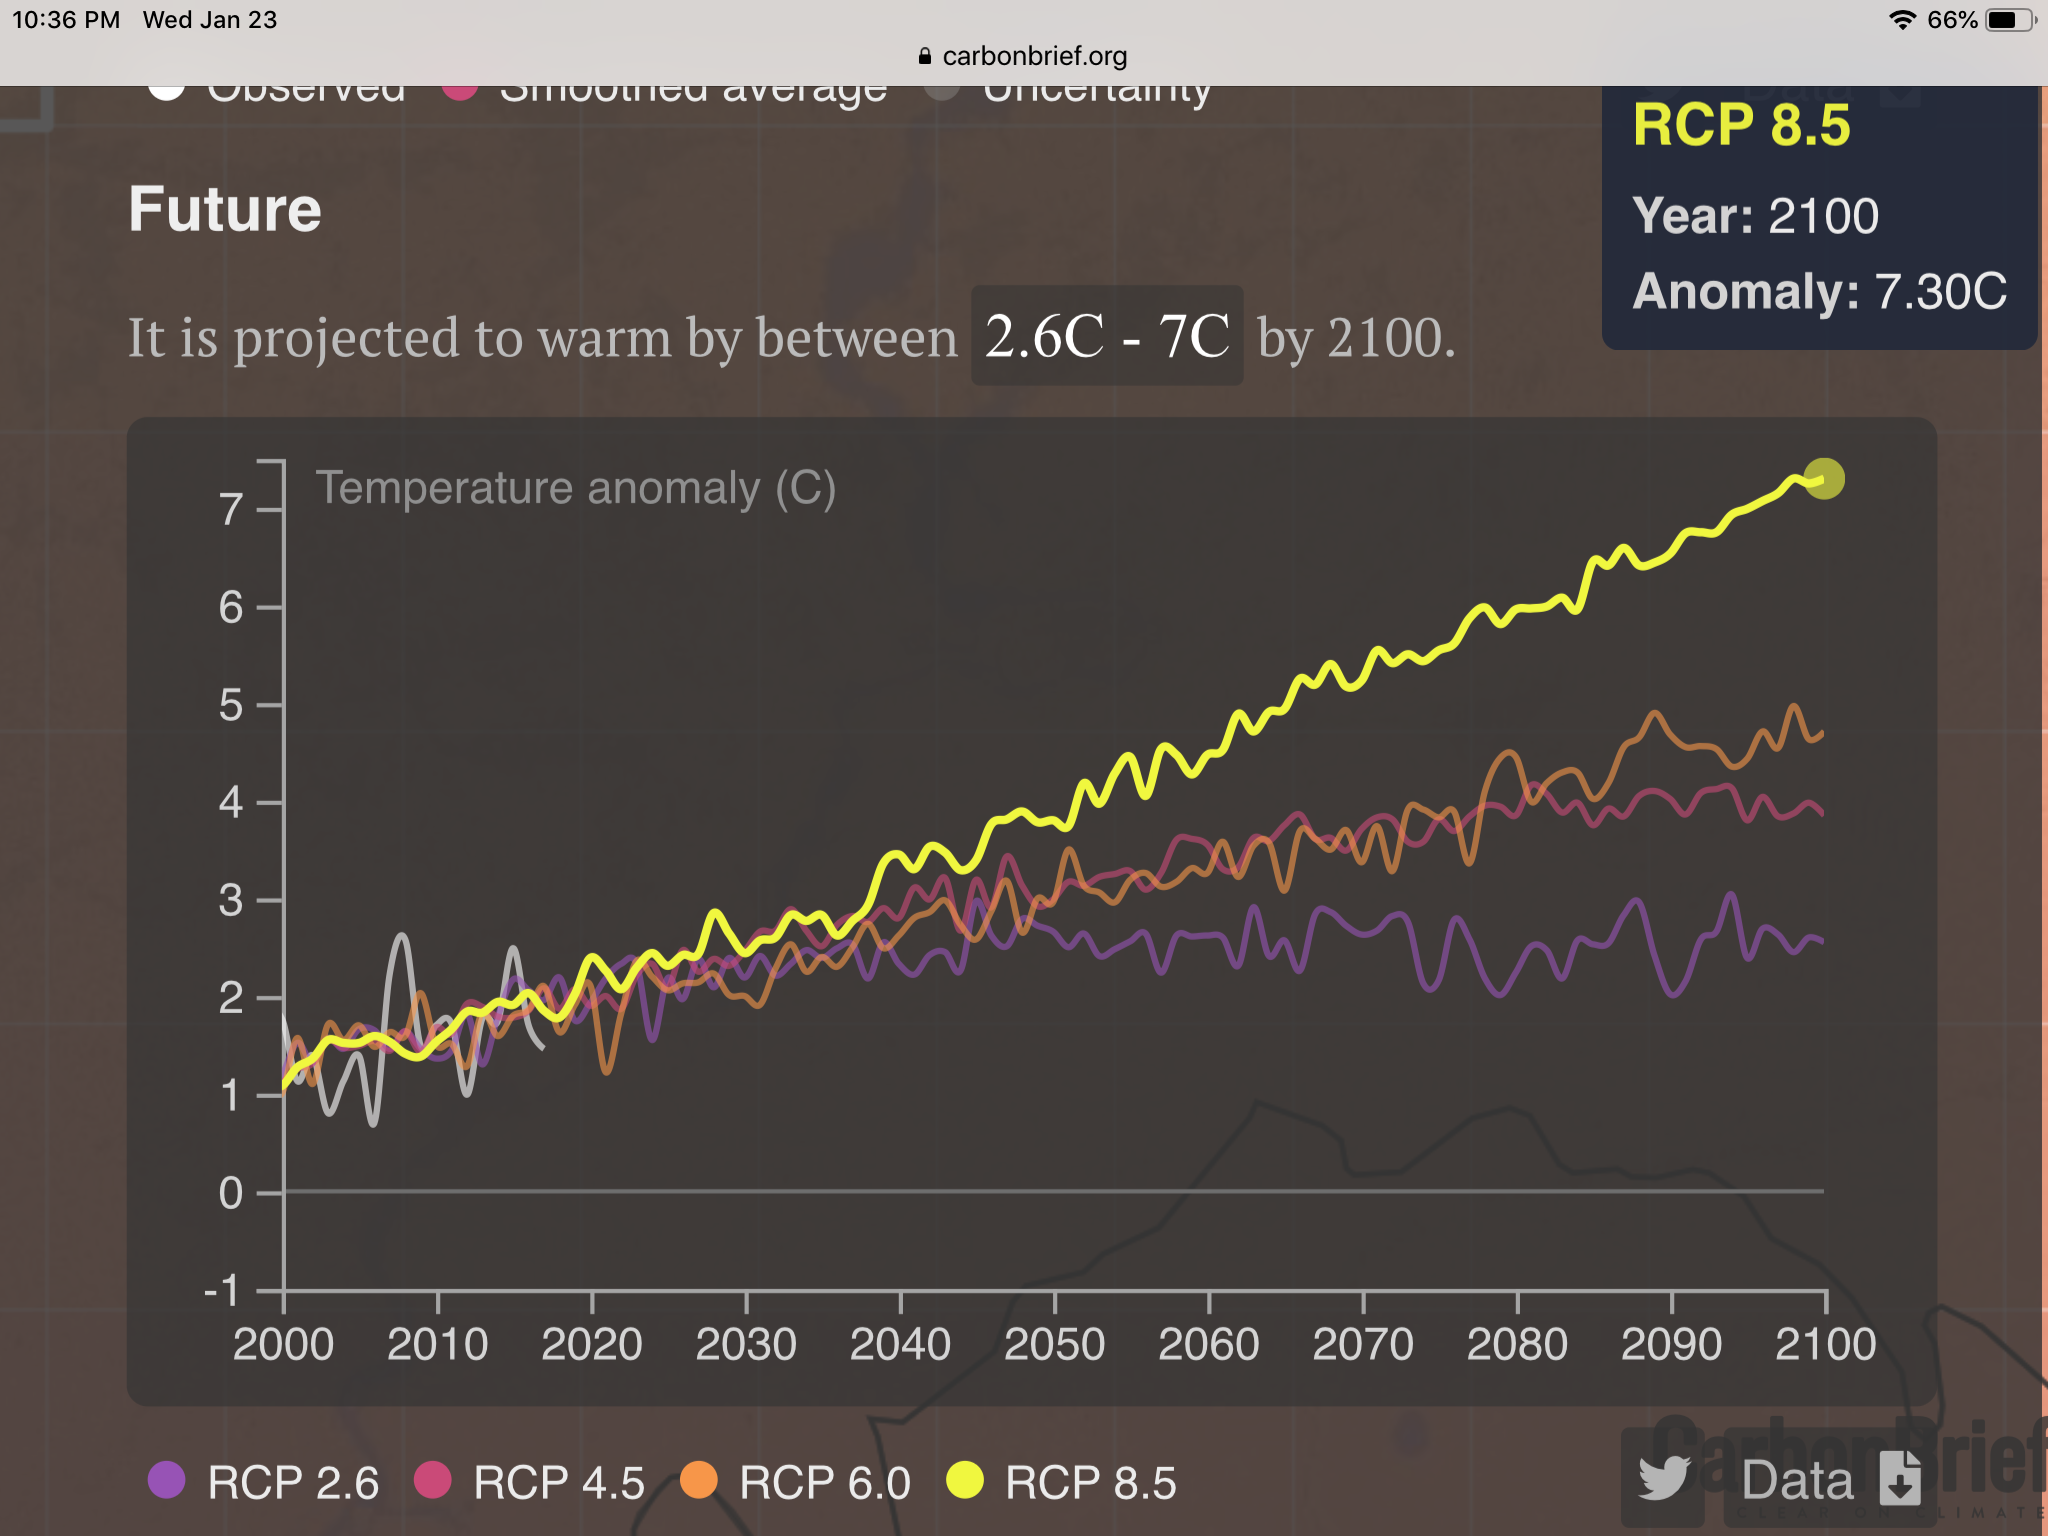
Below is the projected warming to 2100 for Moscow. The yellow curve is for RCP8.5, and I have put a dot on this curve at 2100 to get the value of 7.30 ºC, or 13.1 ºF. The White curve on the left is the observed warming. RCP6.0 is not much different from RCP4.5. The drive to zero emissions RCP2.6 is fairly constant after growing to only 2.55 ºC there. The fluctuations give you an estimate of the uncertainty in the values from the simulation. There of course are systematic errors from the state of current climate knowledge, which aren’t shown.