
The IHME March 31 Projections carry warnings of the fourth surge with rapid reopening and more aggressive variants. The US death rate will remain constant throughout April. In the Worse case projection, the death rate will rise until mid-May.
21% of the US is infected in the model. The tested infections have reached 30 million, but with a 50% current detection rate, there are then 21% of 330 million, or 69 million infected. Research has shown that even one vaccine shot greatly increases immunity for those who have been infected.
70% will accept or possibly accept a vaccine, which is slightly declining. The US average masking is 74%.
As of Friday, April 2, 102 million Americans have received at least one vaccine doses, and they are currently averaging about 3 million shots a day. 31% of the US have received at least one dose, and 17% or 58 million are fully vaccinated. The projection is for 186 million to be vaccinated by July 1. Those getting at least one shot reach that by the fourth week in April in the projections, which then levels off there.
The Pfizer vaccine was highly effective in preventing symptomatic cases out to six months. It was also shown to be highly protective against the South African variant, B.1.351.
By July 1, three months from now, the Current projection is that there will be 61,000 more deaths from March 29, giving a total of 609,000 Covid-19 deaths. Going to 95% masking would save 11,000 lives. Going to the Worse case would cause 42,000 more deaths than the Current projection, giving 651,000 deaths by July 1. The projections all include 50,800 lives to be saved by vaccinations between now and July 1.
We examine the US, the four largest states and Michigan, and list their Populations, the Percent Masking, Those Accepting or Possibly Accepting of Vaccination, the Percent Infected already, the number Vaccinated by July 1, and the number whose lives will have been Saved by Vaccination.
| Data | US | CA | TX | FL | NY | MI |
| Pop. | 330m | 40m | 30m | 20m | 20m | 10m |
| Masking | 74% | 81% | 71% | 69% | 83% | 76% |
| Accepting | 70% | 78% | 69% | 70% | 75% | 69% |
| Infected | 21% | 19% | 27% | 20% | 31% | 17% |
| Vaccinated | 186m | 25.5m | 15.5ml | 12.5m | 13.3m | 5.5m |
| Saved | 50,800 | 3,700 | 3,600 | 5,400 | 2,900 | 1,500 |
We present the projected cases for the US and the four largest states: California, Texas, Florida, and New York. Then we present the projection for the expanding cases in Michigan.

We see that even the Current projection for the US stays flat at 1,000 deaths a day throughout April, and in the Worse case can increase to 1,700 and still stay around a 1,000 deaths a day until July 1. This is the fourth wave if we do not still act responsibly.

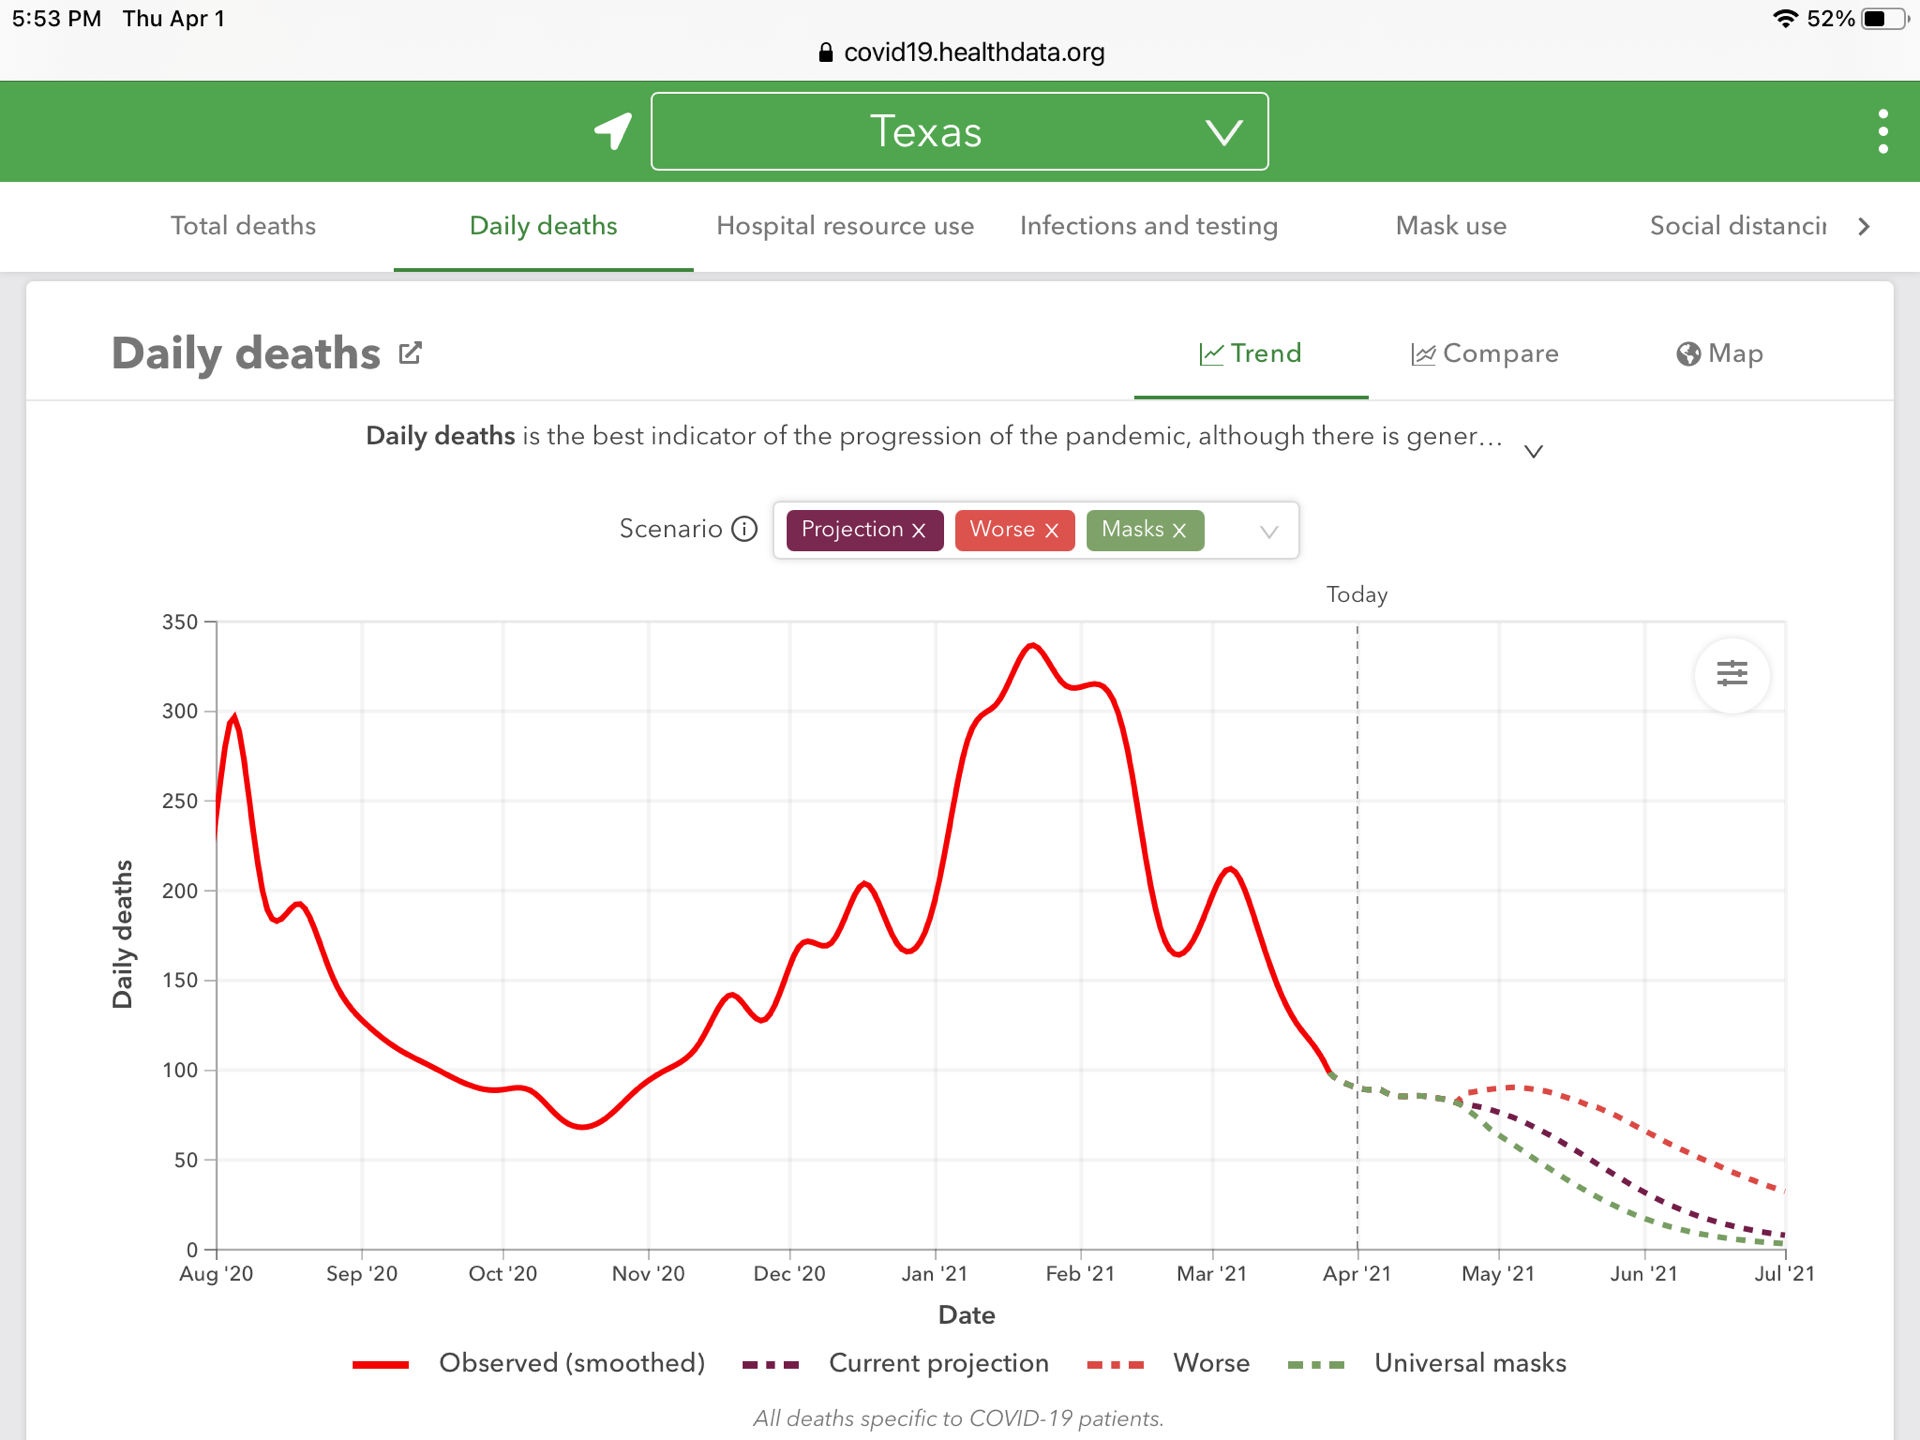

The Current projection is a rise for Florida, and the Worse case rises to double the current daily deaths. Texas, Florida, and New York are modeled as having 50%-74% of the highly infectious and deadly UK B.1.1.7 variant. California only has 10%-24% of the B.1.1.7 variant.


Michigan has done well, but even in the Current projection shows a serious fourth wave. Michigan is 90%-100% the B.1.1.7 UK variant, which spreads more rapidly and is more deadly.
Minnisota is the only other state with 90%-100% of the UK variant, but they have driven their infection rate so far down it is not significant.