
We present Student Loan Debt by State from Melanie Hanson at ElectionData.org on April 3, 2022. We start with state maps and include delinquency and default data and how much they have been helped by the pandemic repayment moratorium, which has been extended by President Biden until January, 2023. We then show details for the four largest population states, which together account for a third of the US population. They also are home to at least seven future Presidential candidates.
We first note that the average debt per student in the different states is still pretty much in the same range, of $30,000 to $40,000 per student, spread across all states.

From the Federal Reserve Bank of New York Liberty Street Economics, we have the delinquency rates and how much they have been reduced by the pandemic moratorium on collections. That will now be extended until January, 2023.
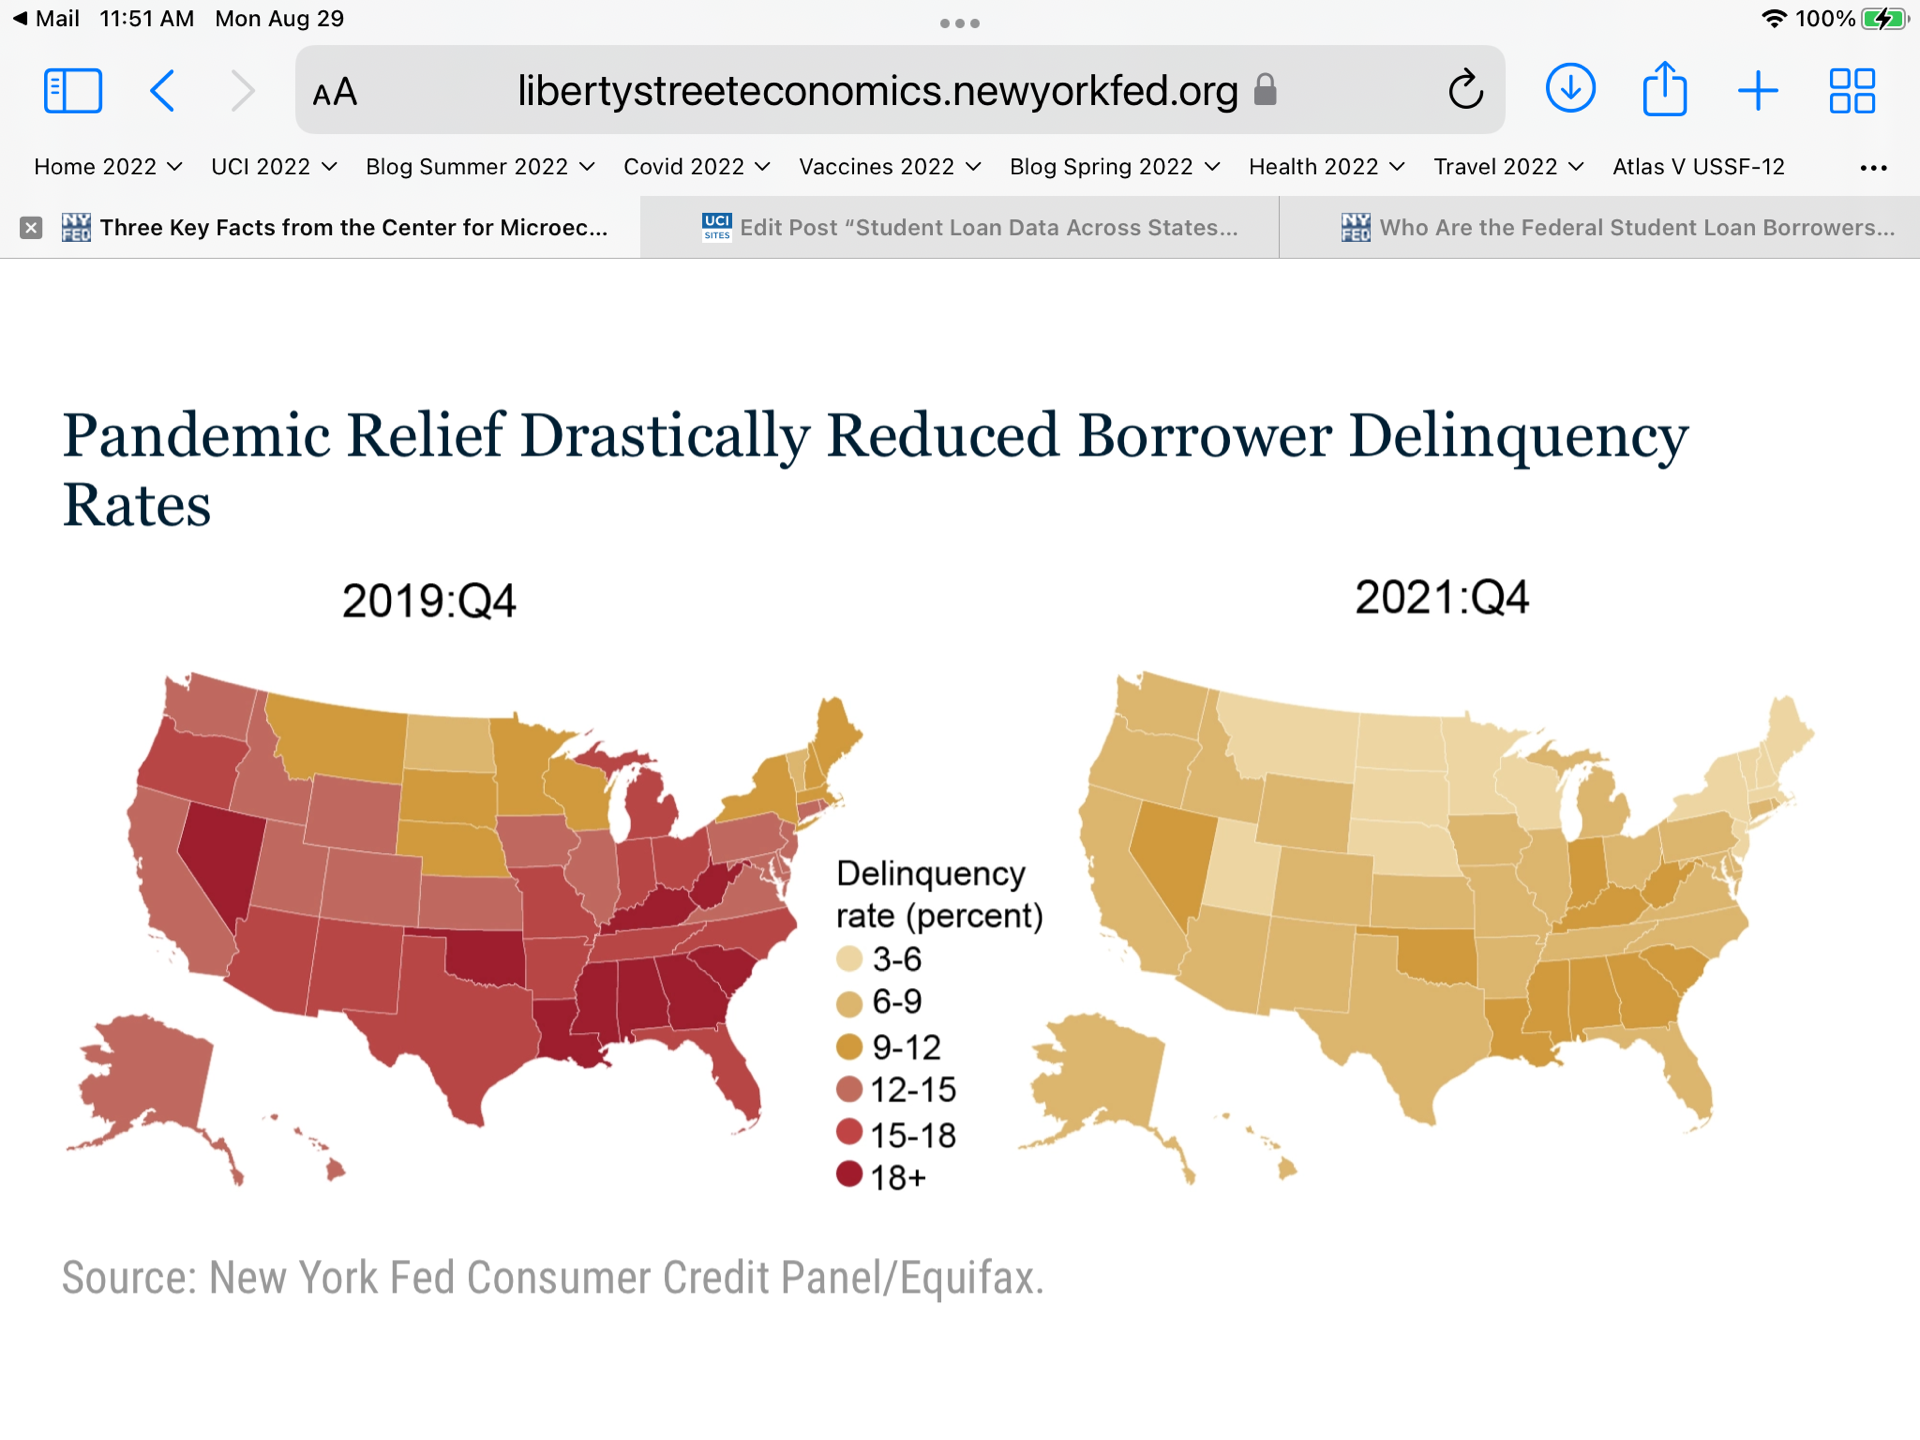
They report that of the ten states with the largest median debt balance, seven are in the Southern Census Region, and are Georgia, Maryland, Virginia, N. Carolina, S. Carolina, Alabama, and Tennessee. The South also had the highest borrower delinquency rates in 10 of the top 12. At the end of 2021, the highest borrower delinquency rates nearly halved. 38 million benefited from the pandemic forbearance pause. Also, Senator Joe Manchin’s West Virginia and Senator Kirsten Sinema’s Arizona also strongly benefitted.
We now present the details of the four largest states of approximate populations: California, 39 million; Texas, 29 million; Florida, 21 million; and New York, 19 million.


We make a table of these four States with their Total Amount Borrowed, Number of Student Borrowers, and Percent of the State Population. Then we add their Totals, and compare it to the US current Total of $1,750 Billion in borrowing by 43 million affected by the relief program.
| State | Amount | Student Borrowers | Percent of Population |
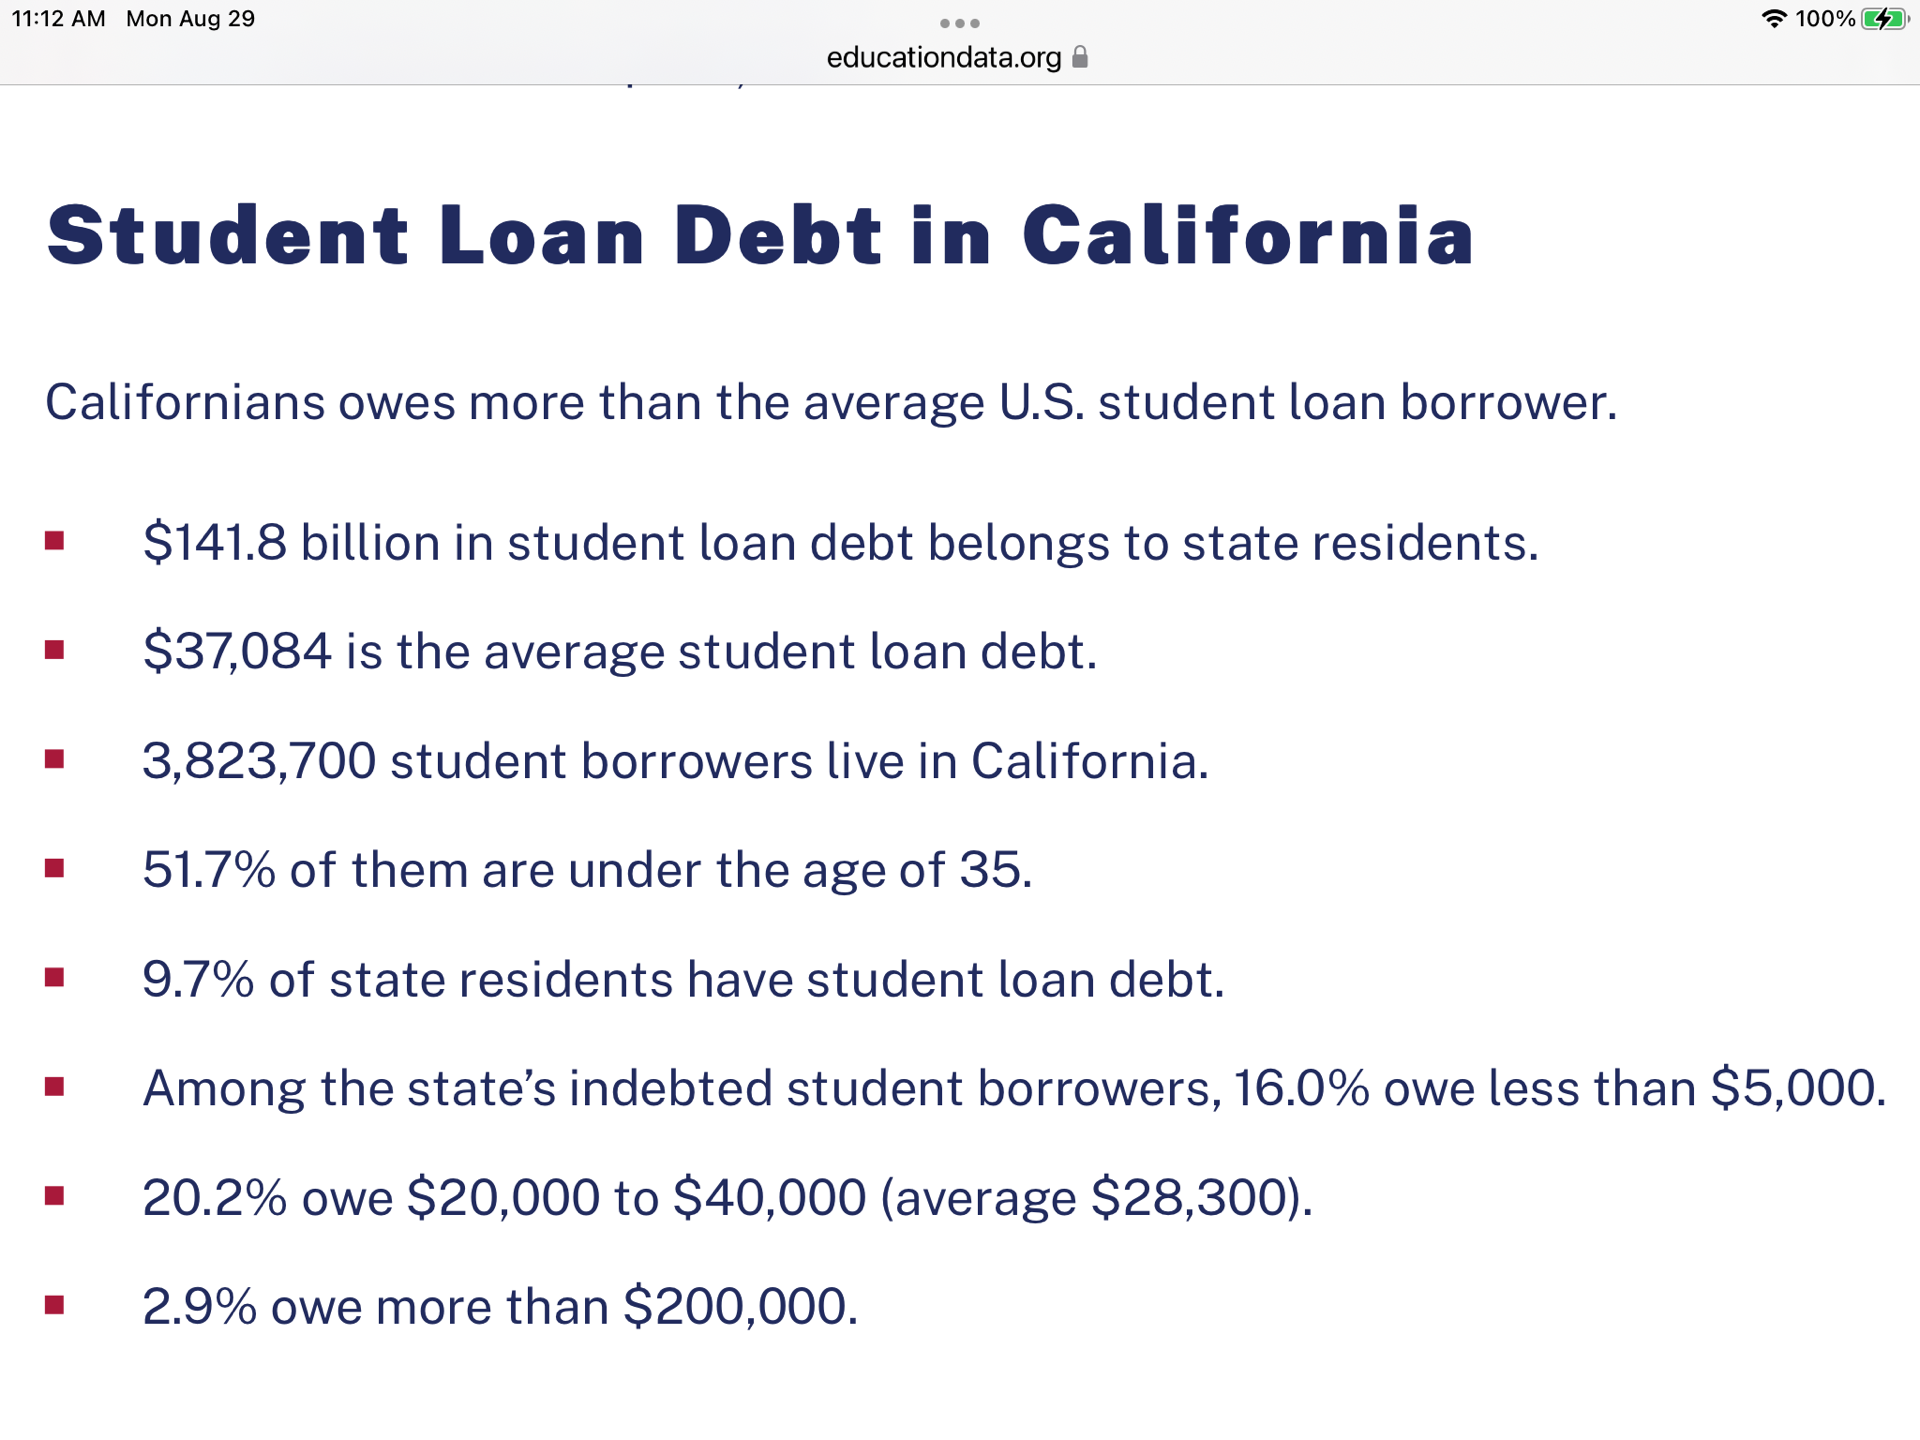
| CA | $142 Billion | 3,824,000 | 9.7% |
| TX | $120 Billion | 3,695,000 | 12.5% |
| FL | $101 Billion | 2,624,000 | 12.2% |
| NY | $93 Billion | 2,460,000 | 12.2% |
| Total | $456 Billion | 15,012,000 | 13.9% |
| US | $1,750 Billion | 43,000,000 | 13.0% |
In terms of the national importance of justifying student aid, we add the observations of the Association of Governing Boards of Universities and Colleges (AGB.org) in 2019. Higher education institutions are the largest employers in ten states, and in two-thirds of America’s 100 largest cities. Higher education employs 4 million people, or 2.5% of the US population.
In the twenty years from 1996 to 2015, there were university tech transfer of 380,000 new inventions. Universities added $591 billion to the GDP, and supported 4.3 million jobs.
When college grads increased by 1% in a region, wages of high school grads increased by 1.6% in that region.
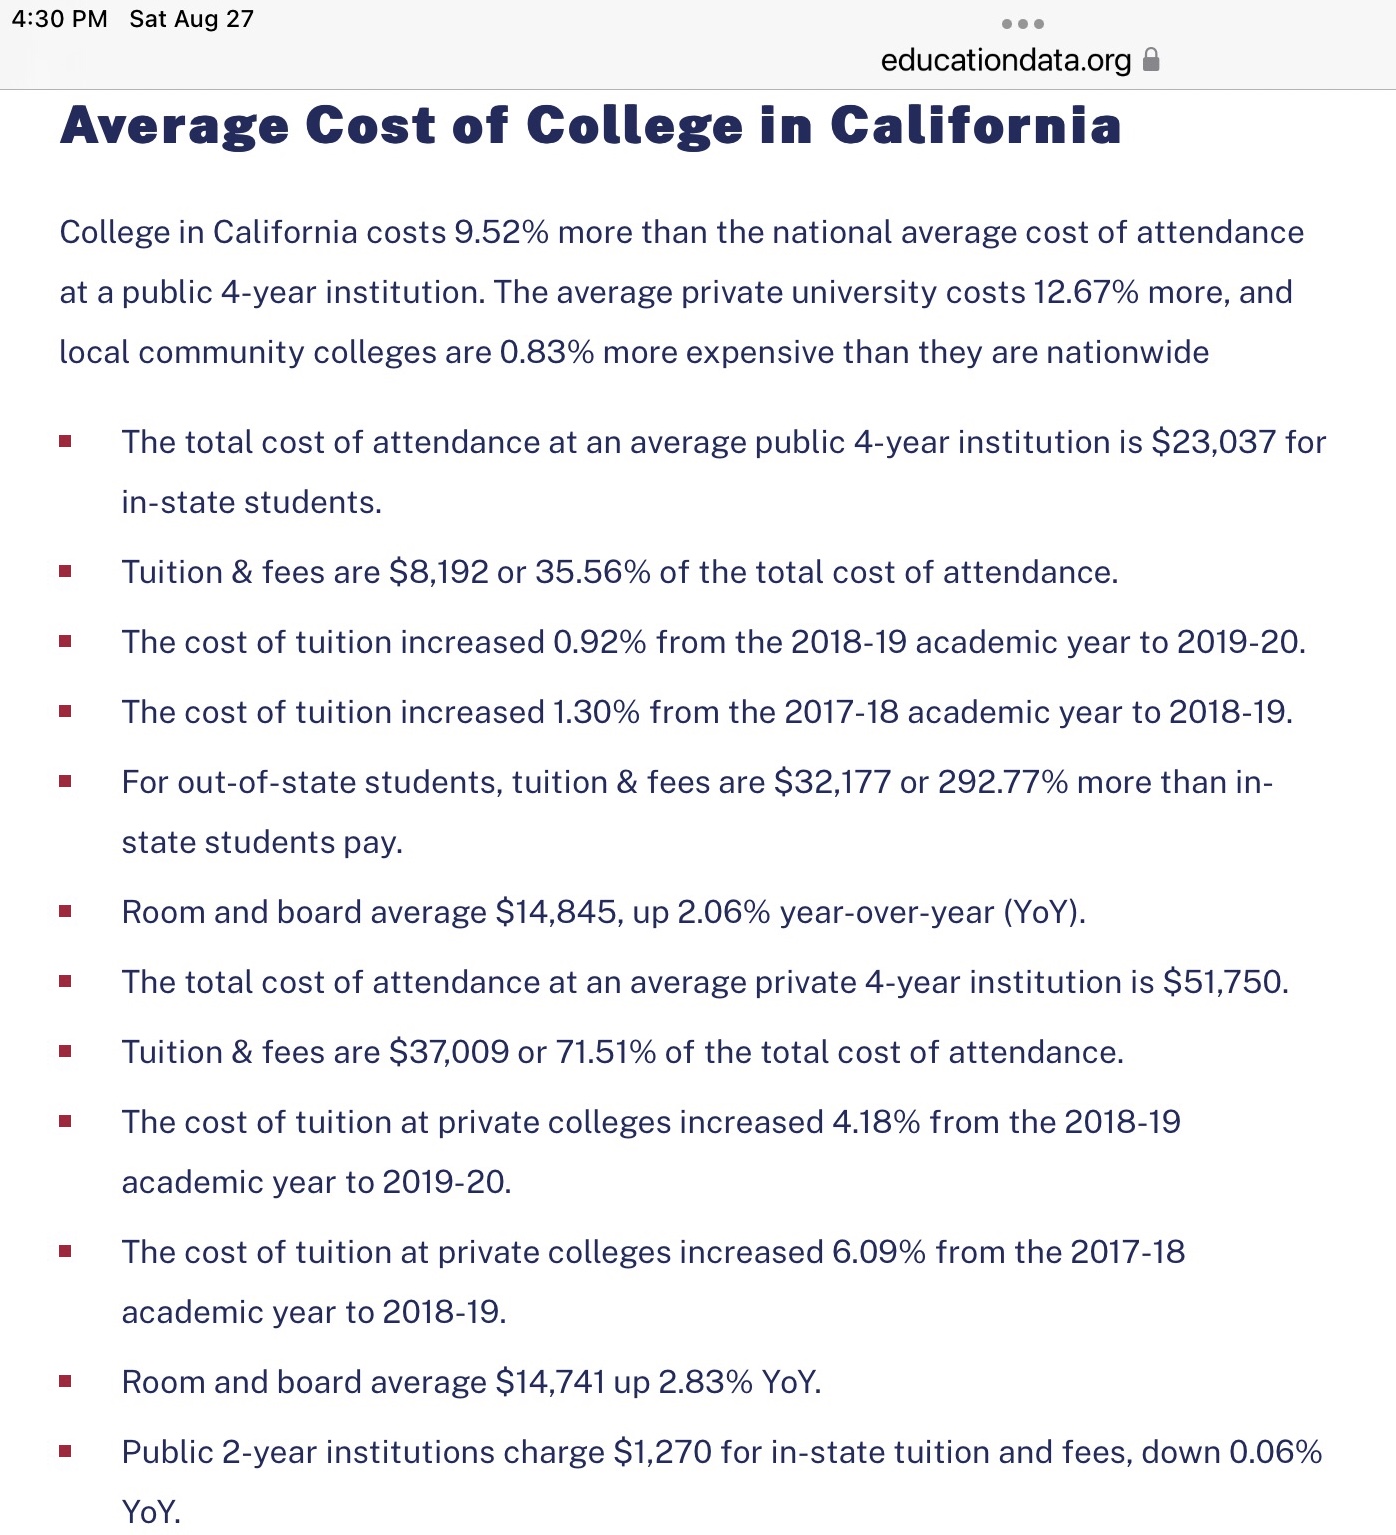
This is the California page of costs from educationdata.org. Unfortunately, they are now three years old.
The University of California system has exceptional student aid in the Blue and Gold Plan, where students from families with less than an $80,000 yearly income have their University system tuition and fees completely covered. UC Admissions states that over 70% of our California undergrads get an average of $18,000 in grants and scholarships to help with costs, including UC tuition, food and housing, transportation, books and supplies.
The Federal Pell Grants for an average university cost cover about $6,000, if your family income is less than $60,000 a year.
These are an example of the current costs of a UC undergraduate, which varies by campus.
