
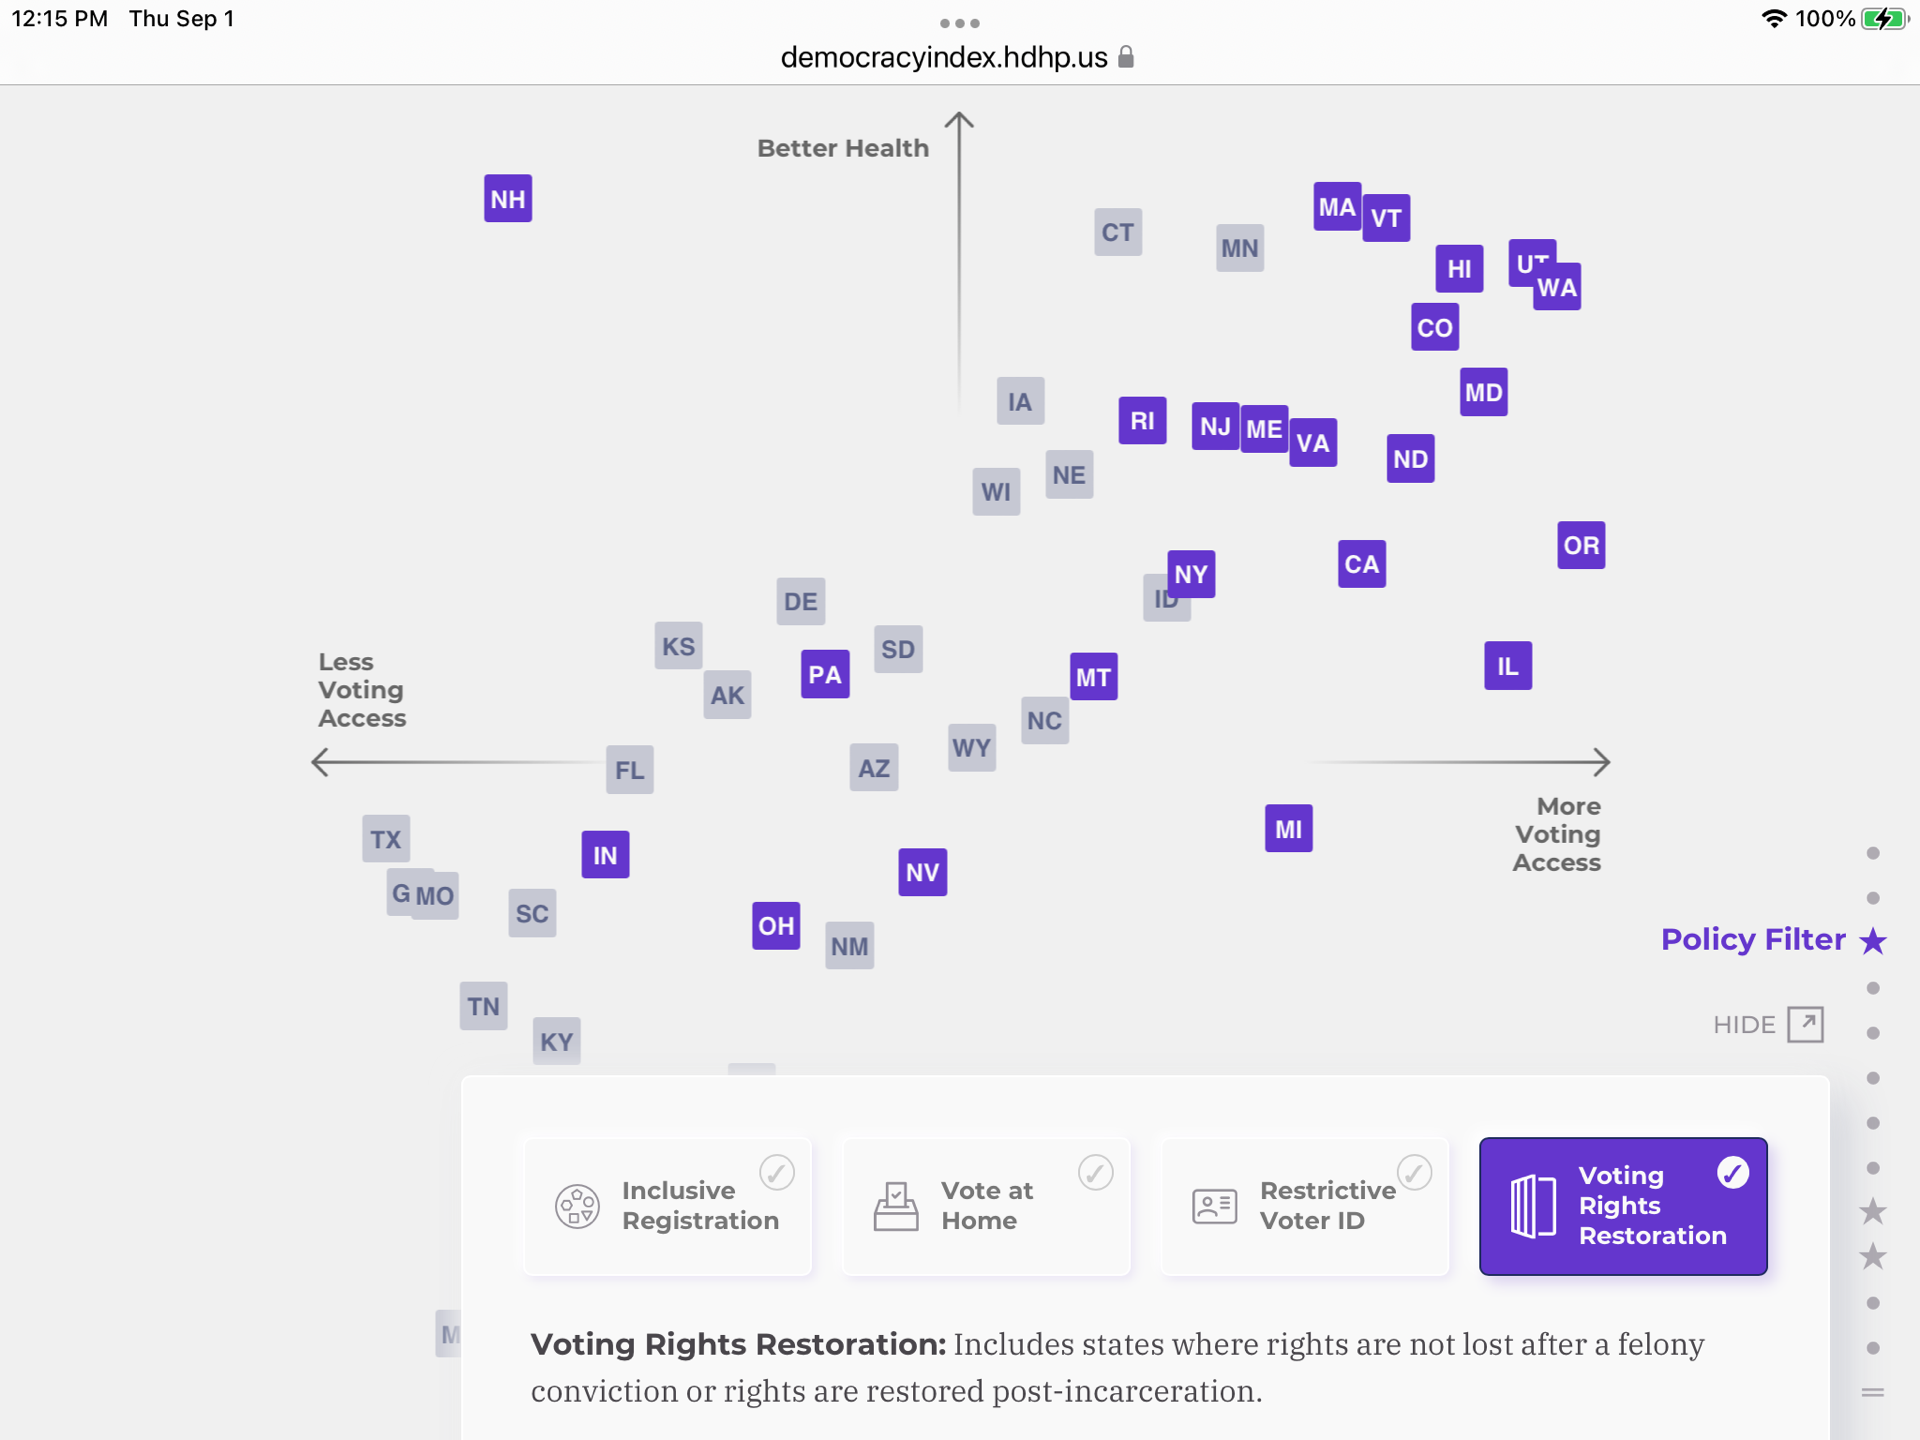
We present key graphs of the index showing the correlation between voting rights in the Healthy Democracy and Health Care in the Healthy People Initiative for all states, and then the health care rankings breakdown for the four most populous states. CA, TX, FL, and NY also figure heavily in supplying Presidential candidates. As the initiative emphasizes, there is a strong correlation between voting rights and ease, and strong health care. There is also a strong correlation between poor voting access, and poor health care. The two feed into each other.
We have often seen examples of states with restrictions on abortions, possibly resulting from extreme gerrymandering, and poor maternity and maternal health care before and after a child is born. These detailed ratings establish where all states lie in these Democracy and Health categories.
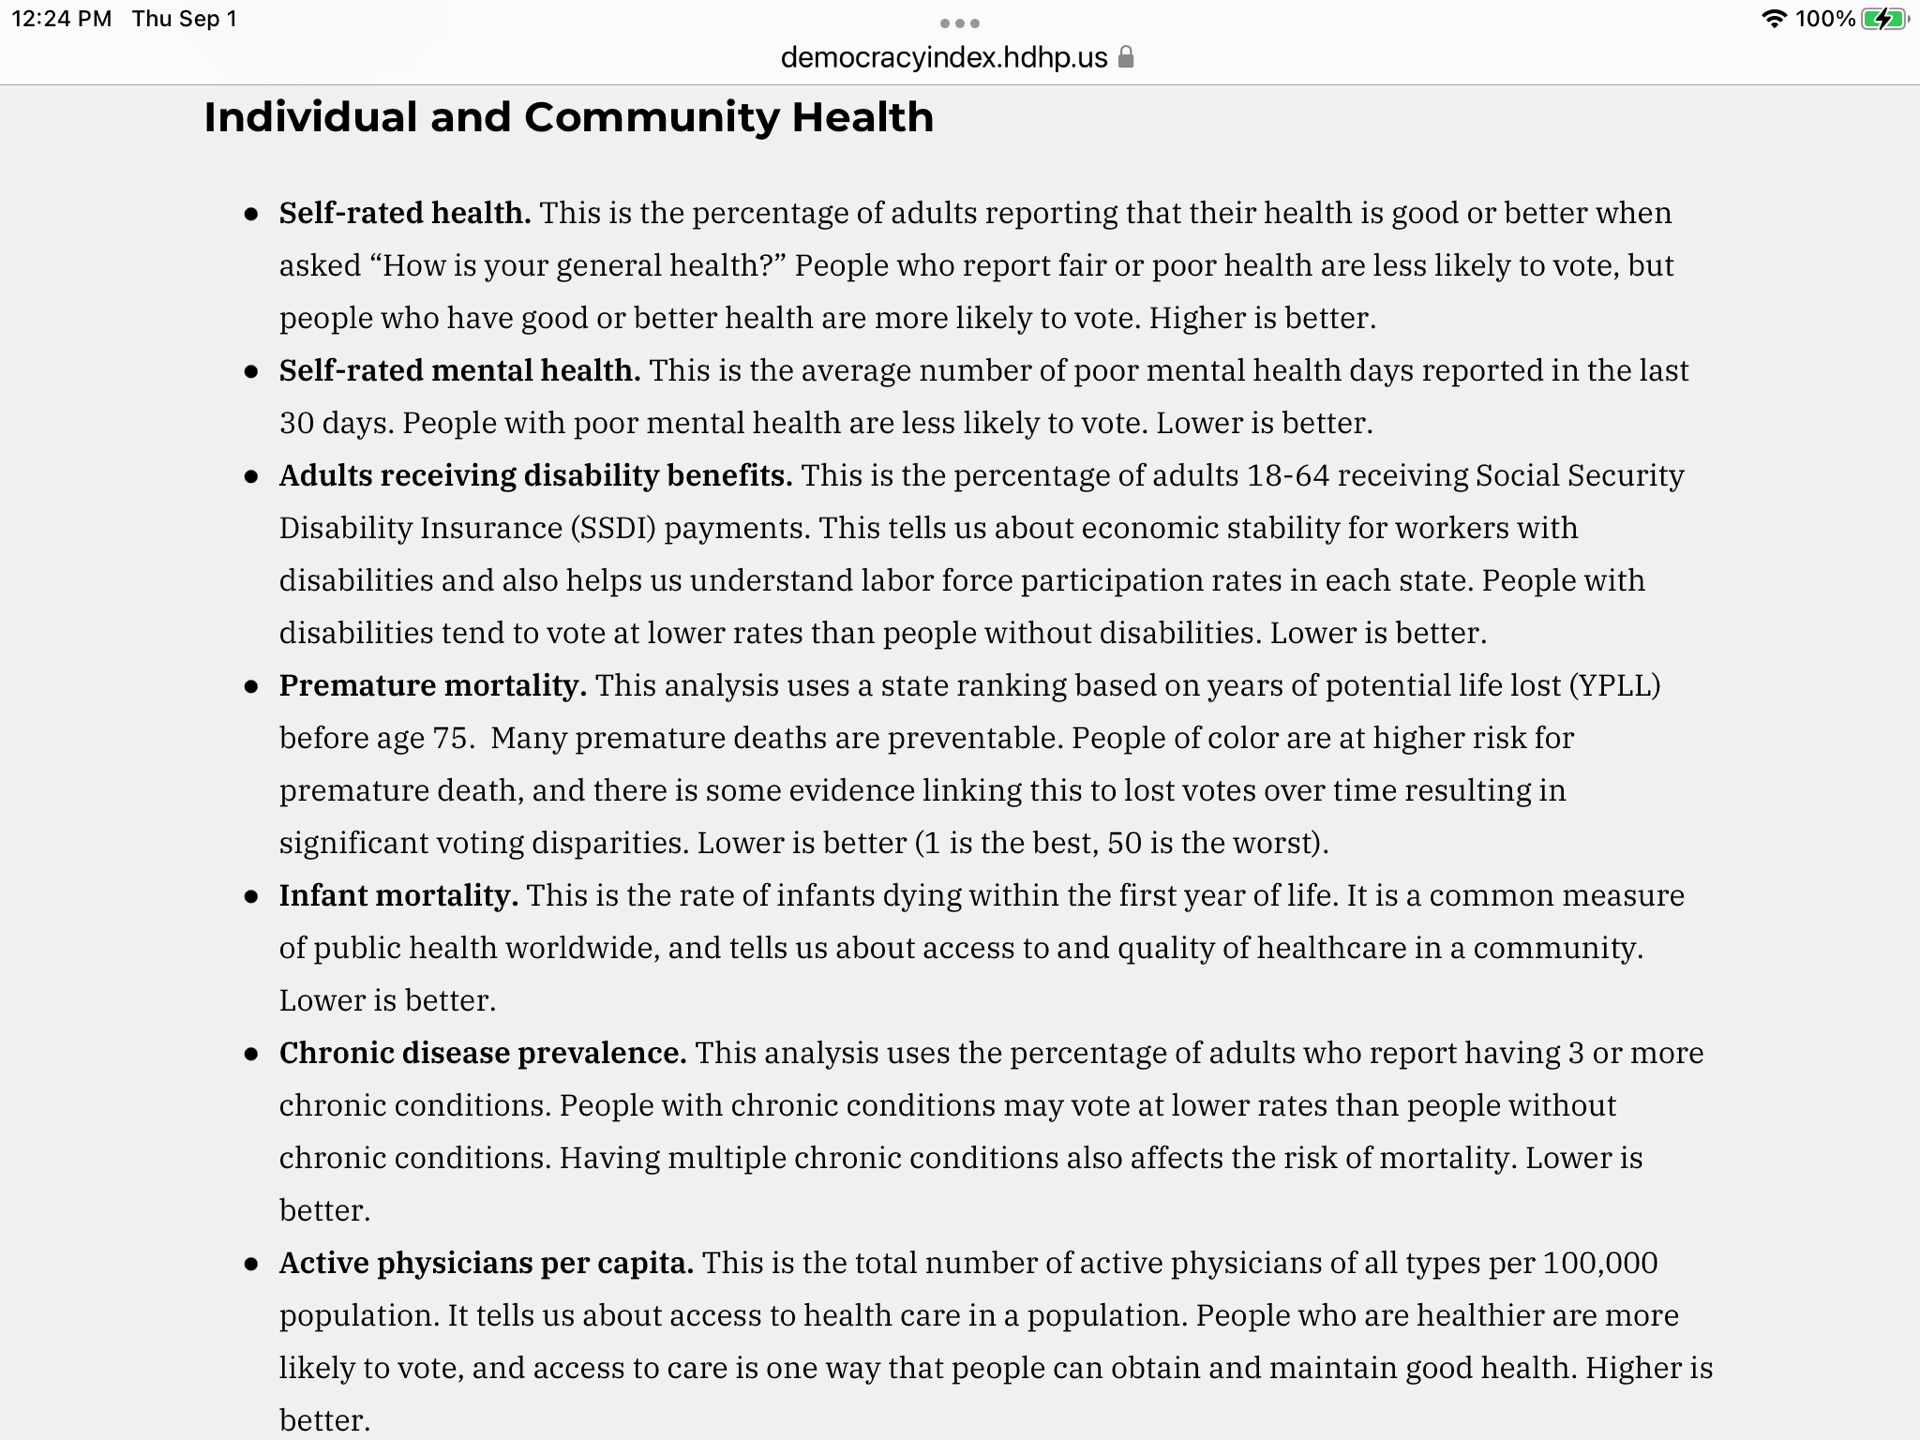
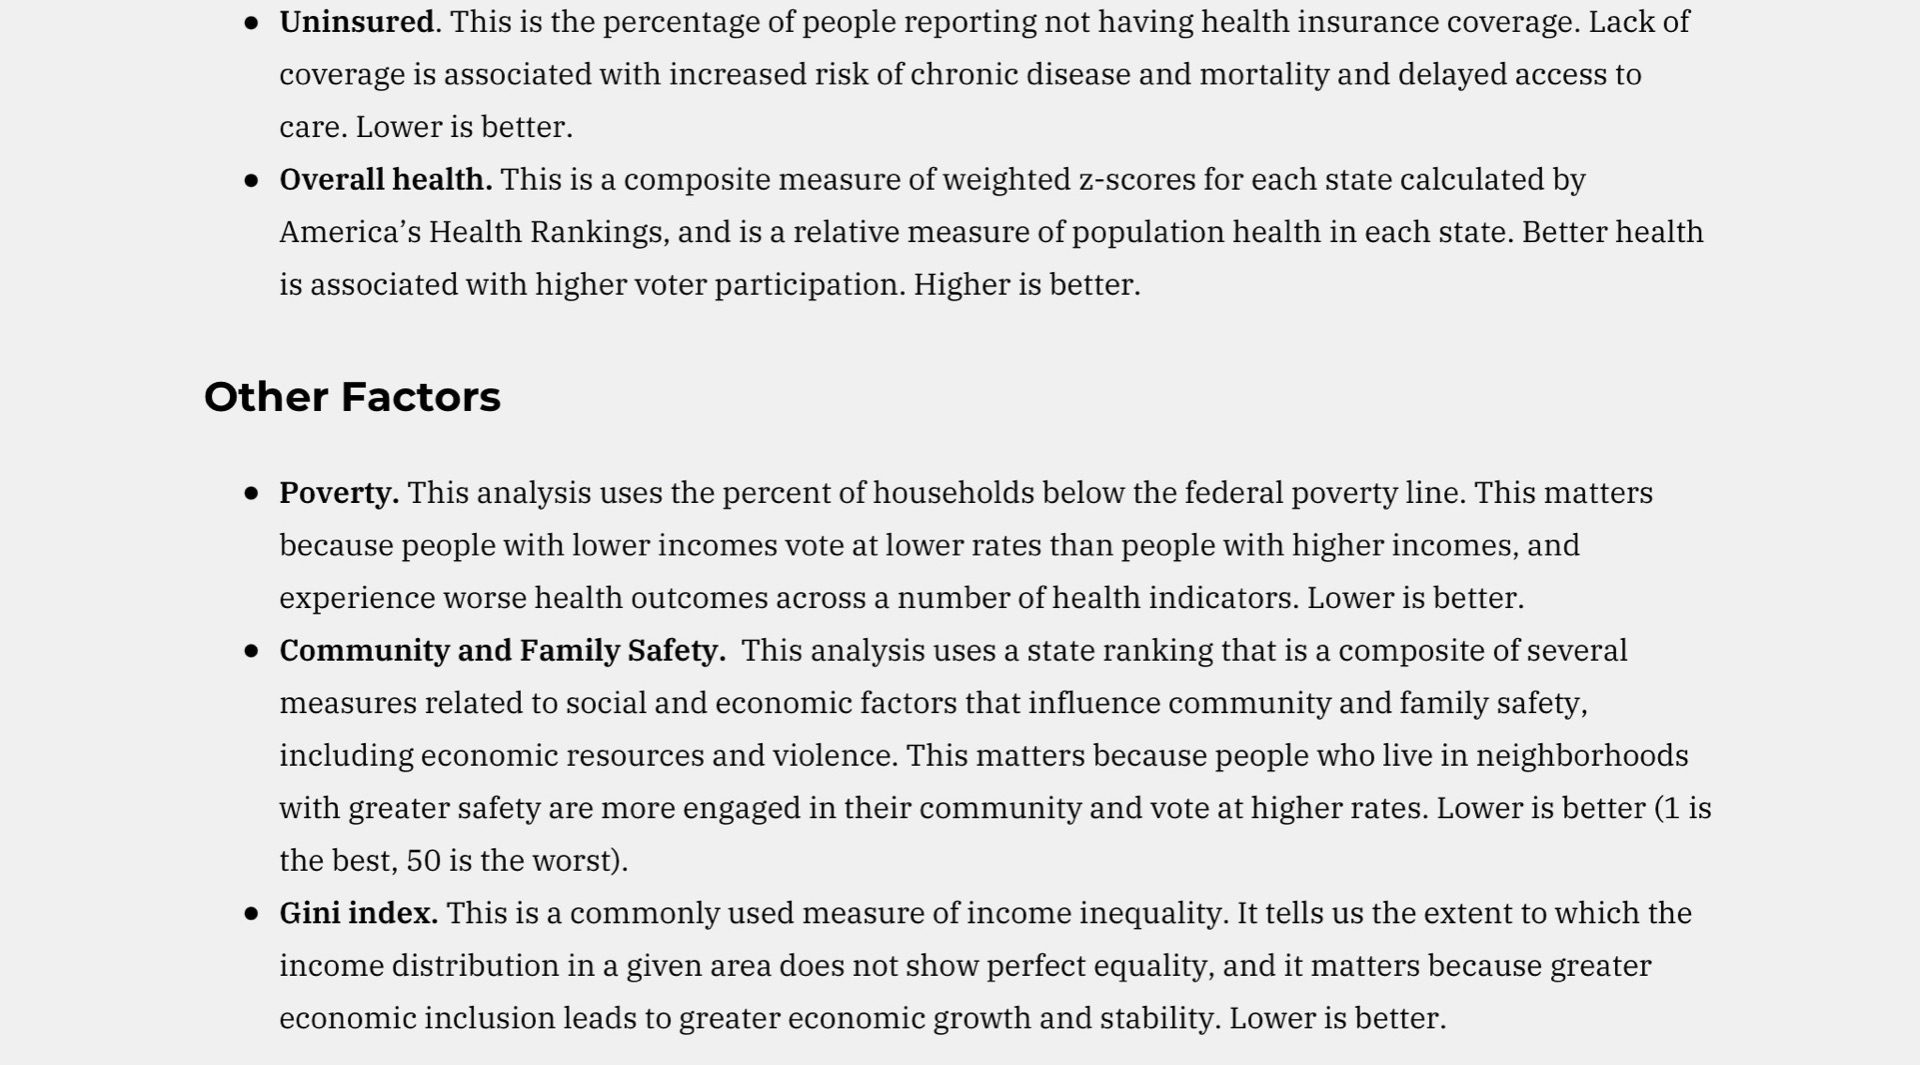
Here are the categories evaluated in the Health Care Index:
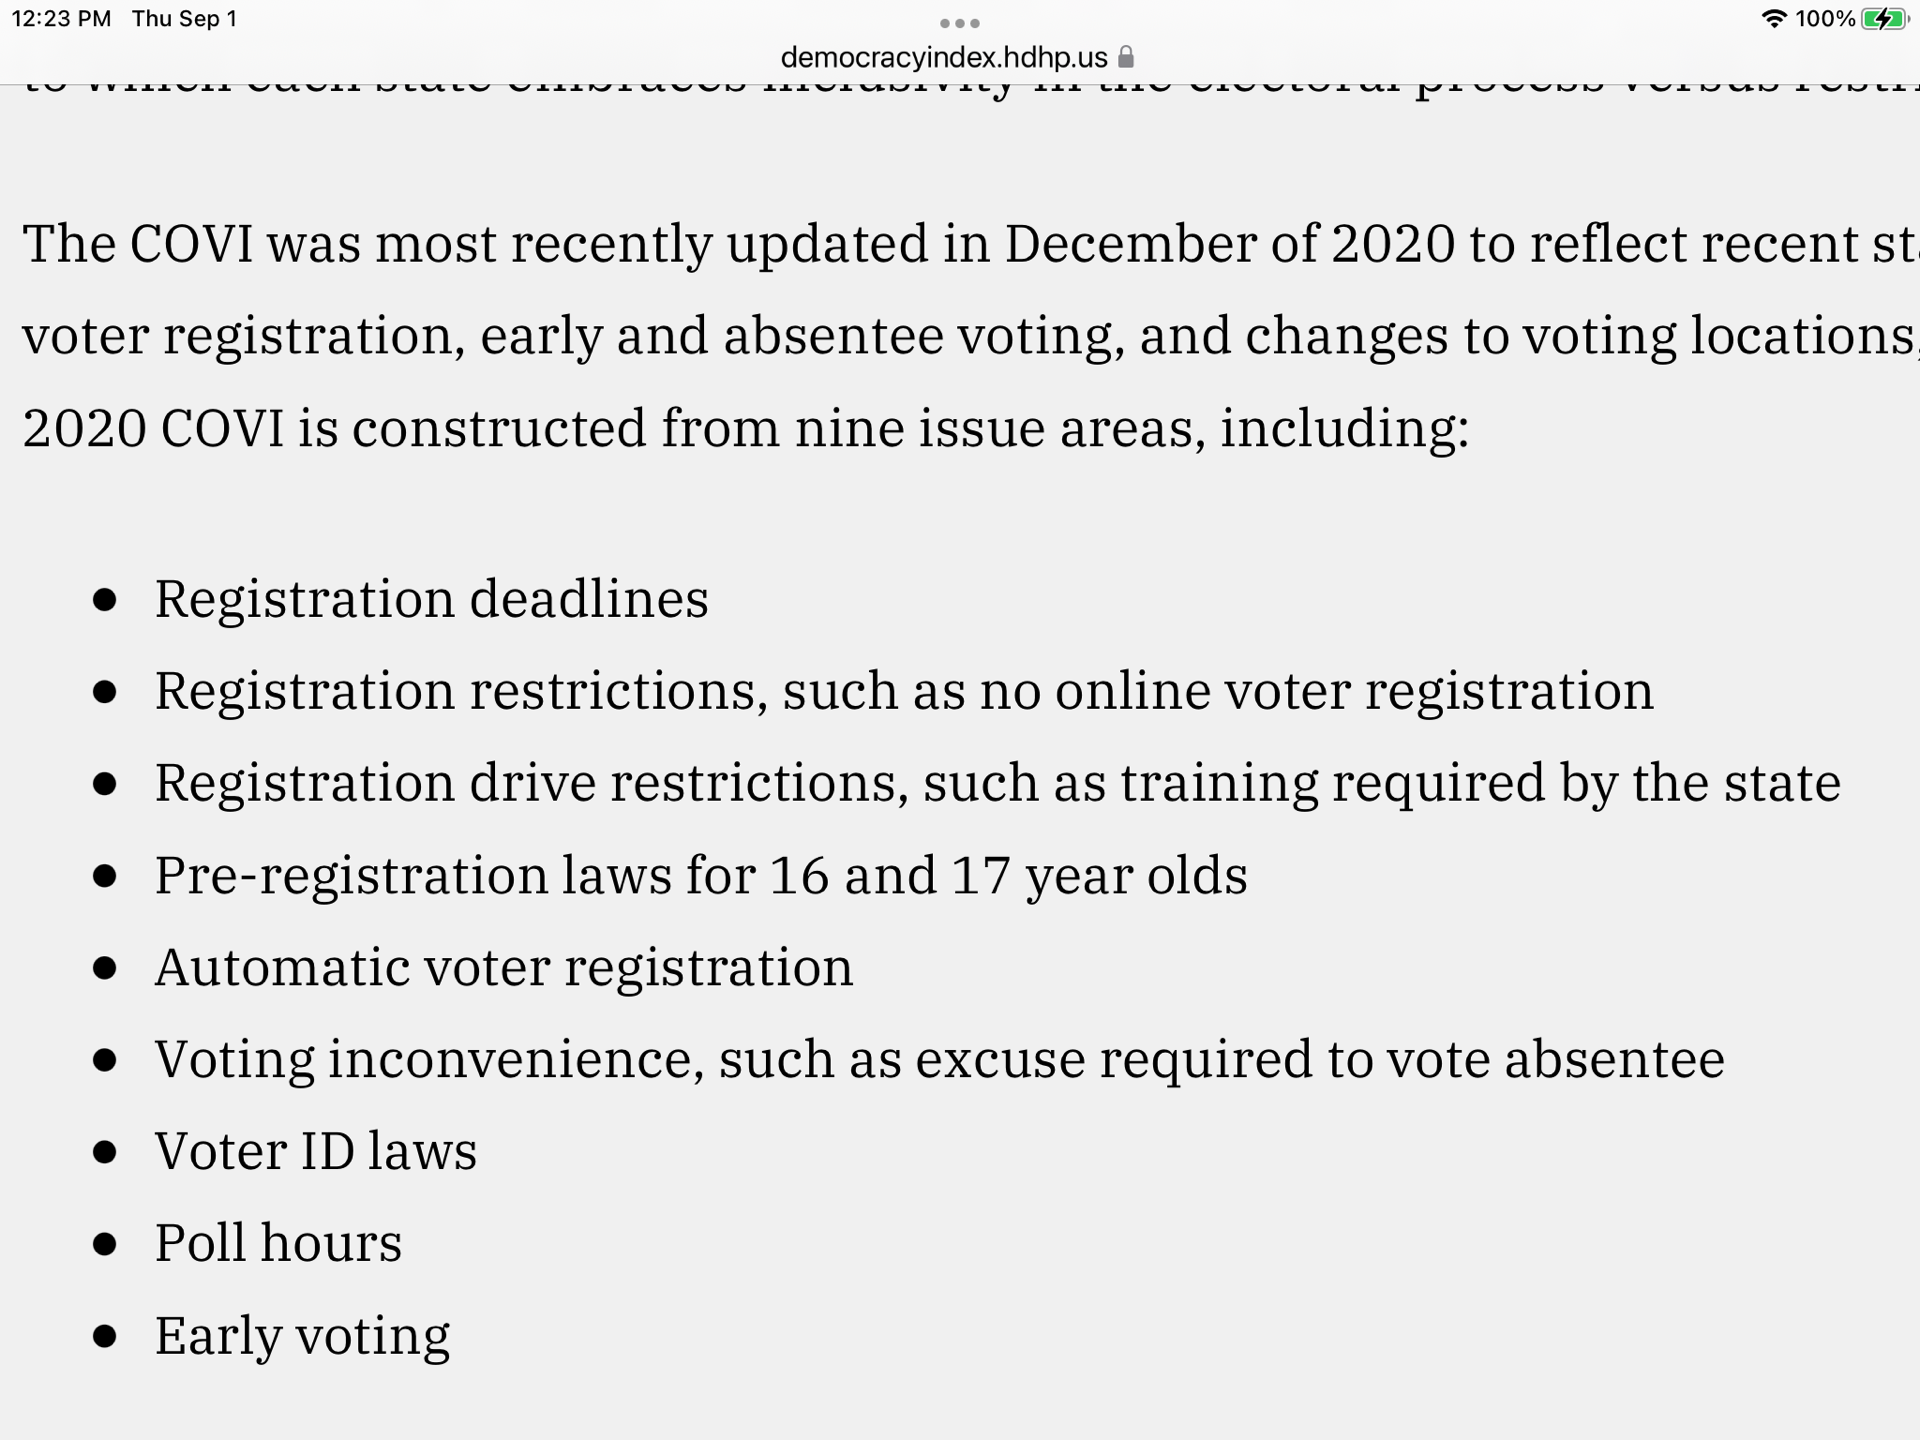
Here are the factors in the Democracy and voting index:
Here are where the individual states rank in the four main voting categories, and in the Health Care index. The purple highlighted states satisfy the given category. Categories Inclusive, Home, and Rights are positive, Restrictions is negative.

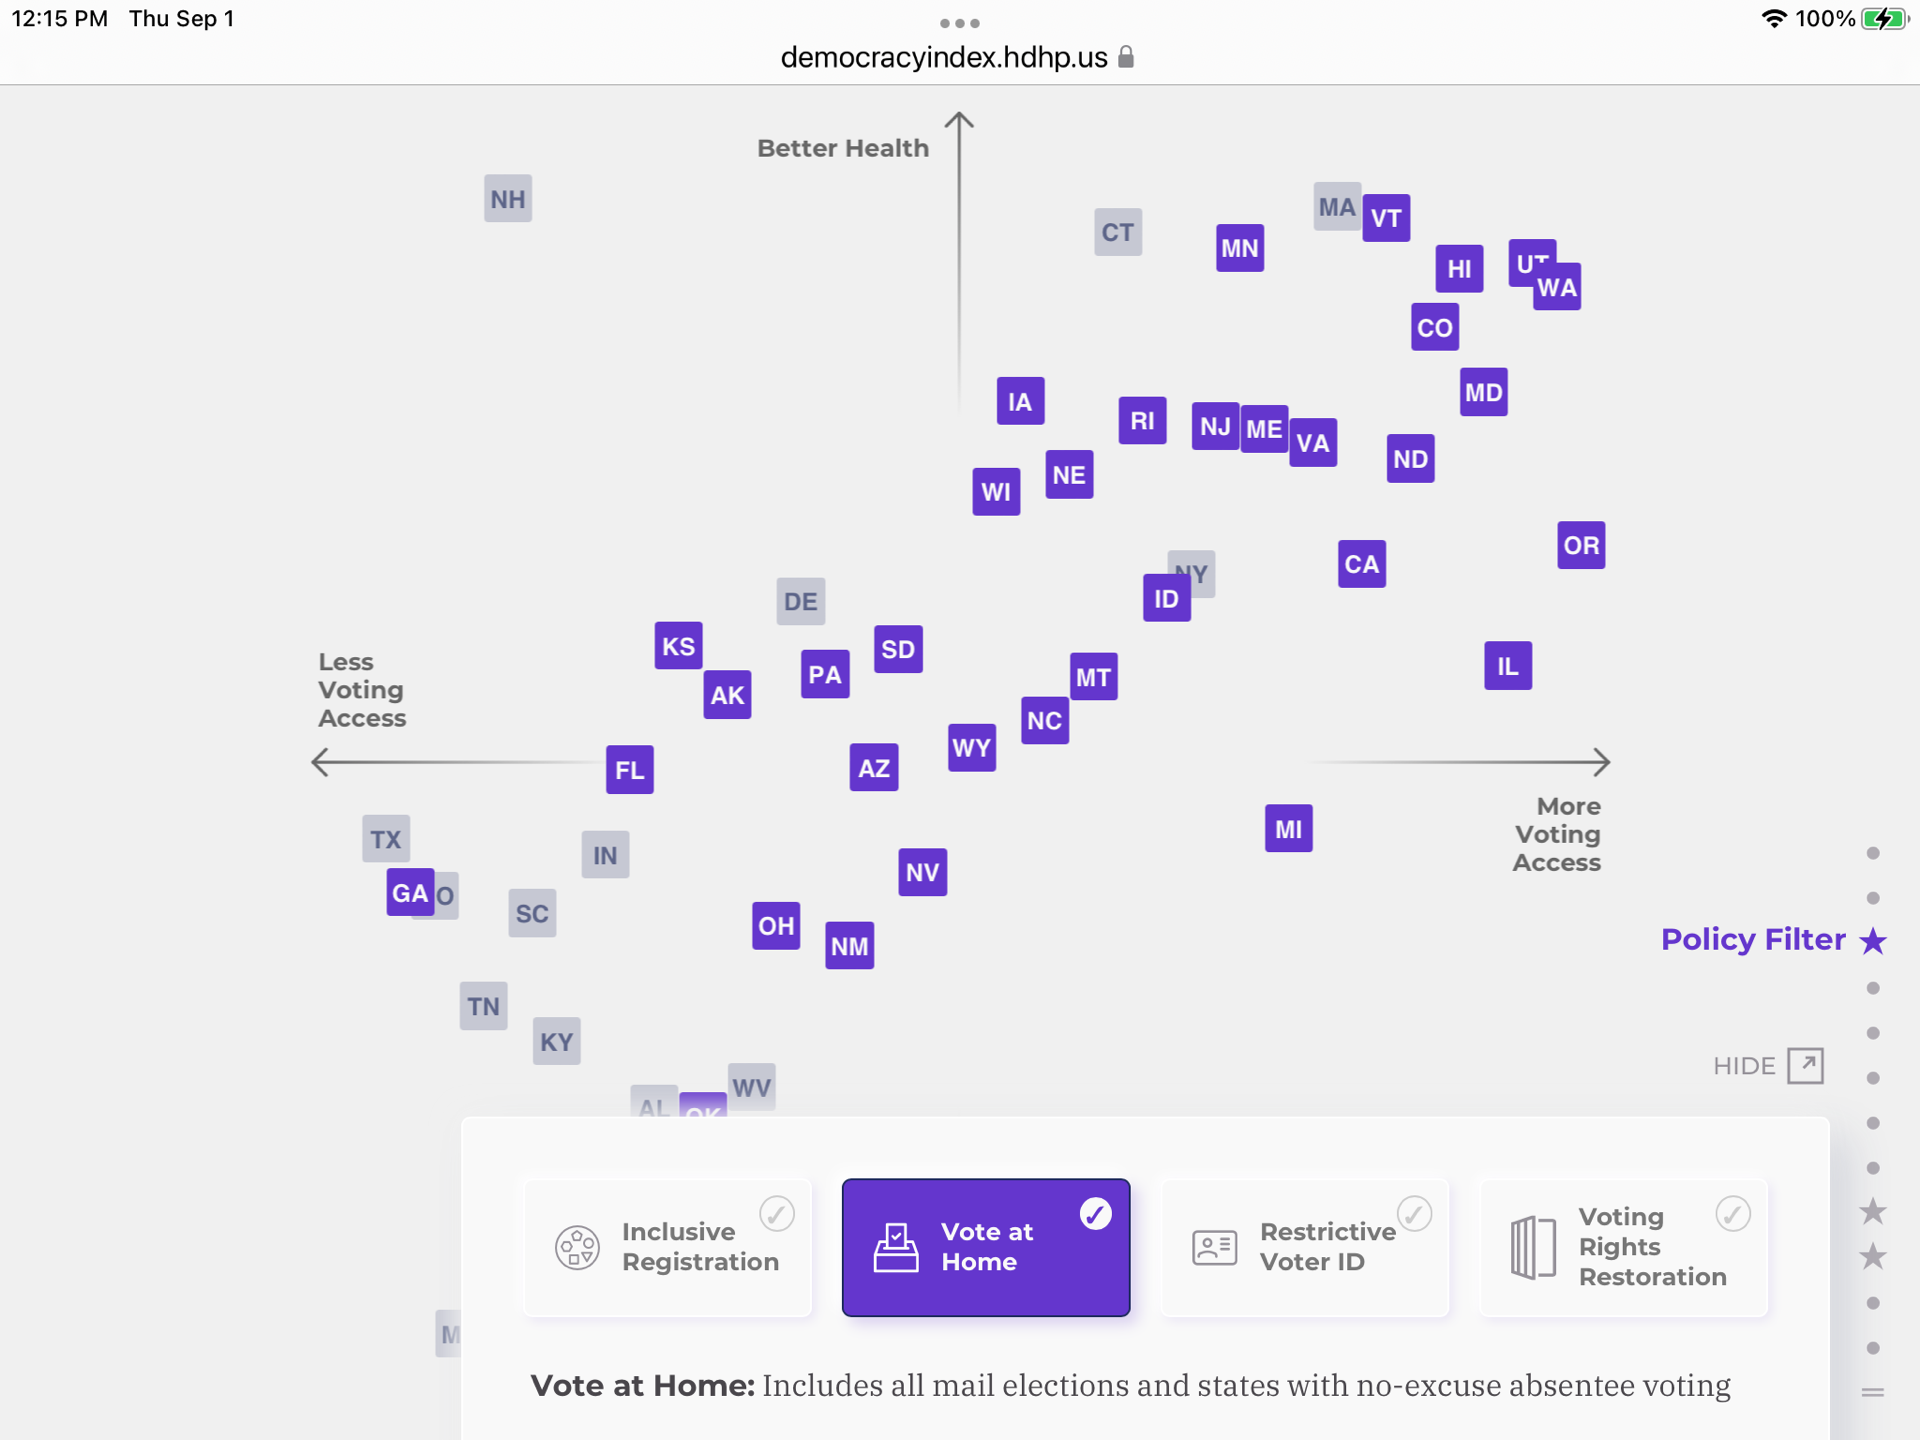

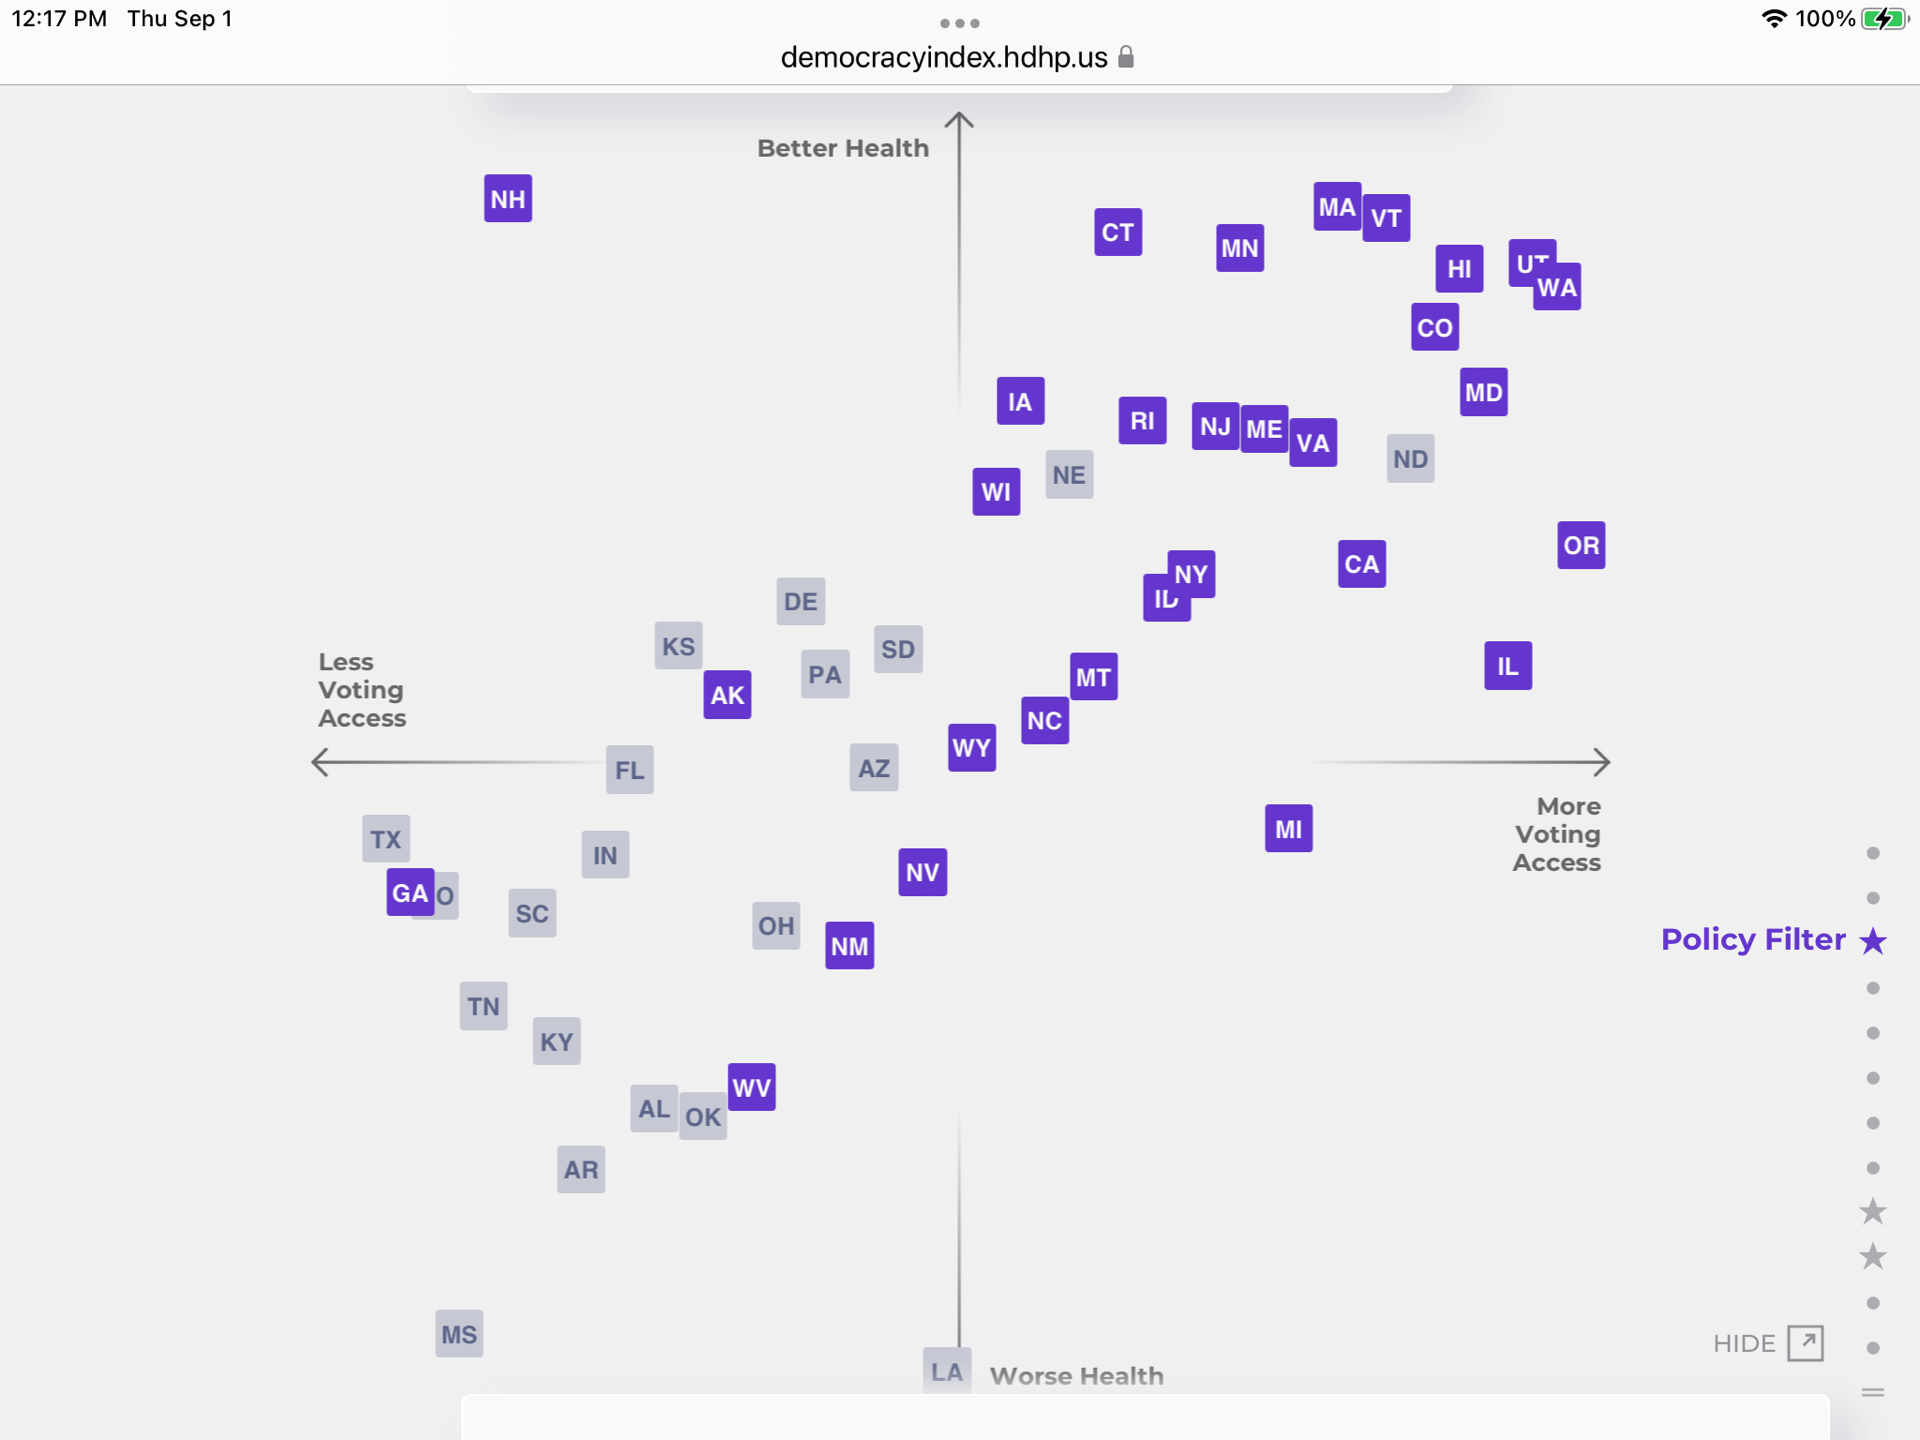
Here is a repeat of the Inclusive Registration category, but showing the states at the bottom left:
What is amazing to me is that California (CA) and New York (NY) are only about a third up on Better Health than Massachusetts at the top. They are both positive in More Voting Access.
Even though Texas sells itself as high tech and attractive to industry, and Florida is supposedly a great retirement state, Texas is negative on Health, and Florida is just zero.
Even worse, Texas is the absolutely worst state on Voter Access. We had a separate article on how greatly Texas has gerrymandered out its Hispanic-American population, which should have equal state representation as its White population. Florida is half-way to the worst on Voter Access.
The highly male dominated Texas legislature has an almost complete ban on abortions. They invented rewarding citizens who sued abortion providers, which the Supreme Court has not limited. A poll from June says that 60% of Texas voters want abortion to be available in all or most cases. Only 11% favor the total ban on abortions.
Abortion in Florida is now only allowed through the fifteenth week. Roe v. Wade allowed it up to the 24th week. In a poll there, 56% want abortion to be available in all or most cases. Governor DeSantis has said he will get more strict on abortion, but he is now running for re-election. He has taken away the rights of ex-felons to vote, despite the public passing such a right.
In the Less Voting Access and Worse Healthcare quadrant, we have to notice the abundance of Southern States which are also Republican. The lowest in Healthcare are MS and LA. Far down in both axes is KY of Senate Minority Leader Mitch McConnell. Also there are the Southern TX, GA, MO, TN, AR, AL, OK, SC. There is also IN and the WV of Senator Joe Manchin, who is a Democrat in a strongly Republican state.
Here are the credits to the people who created this work:

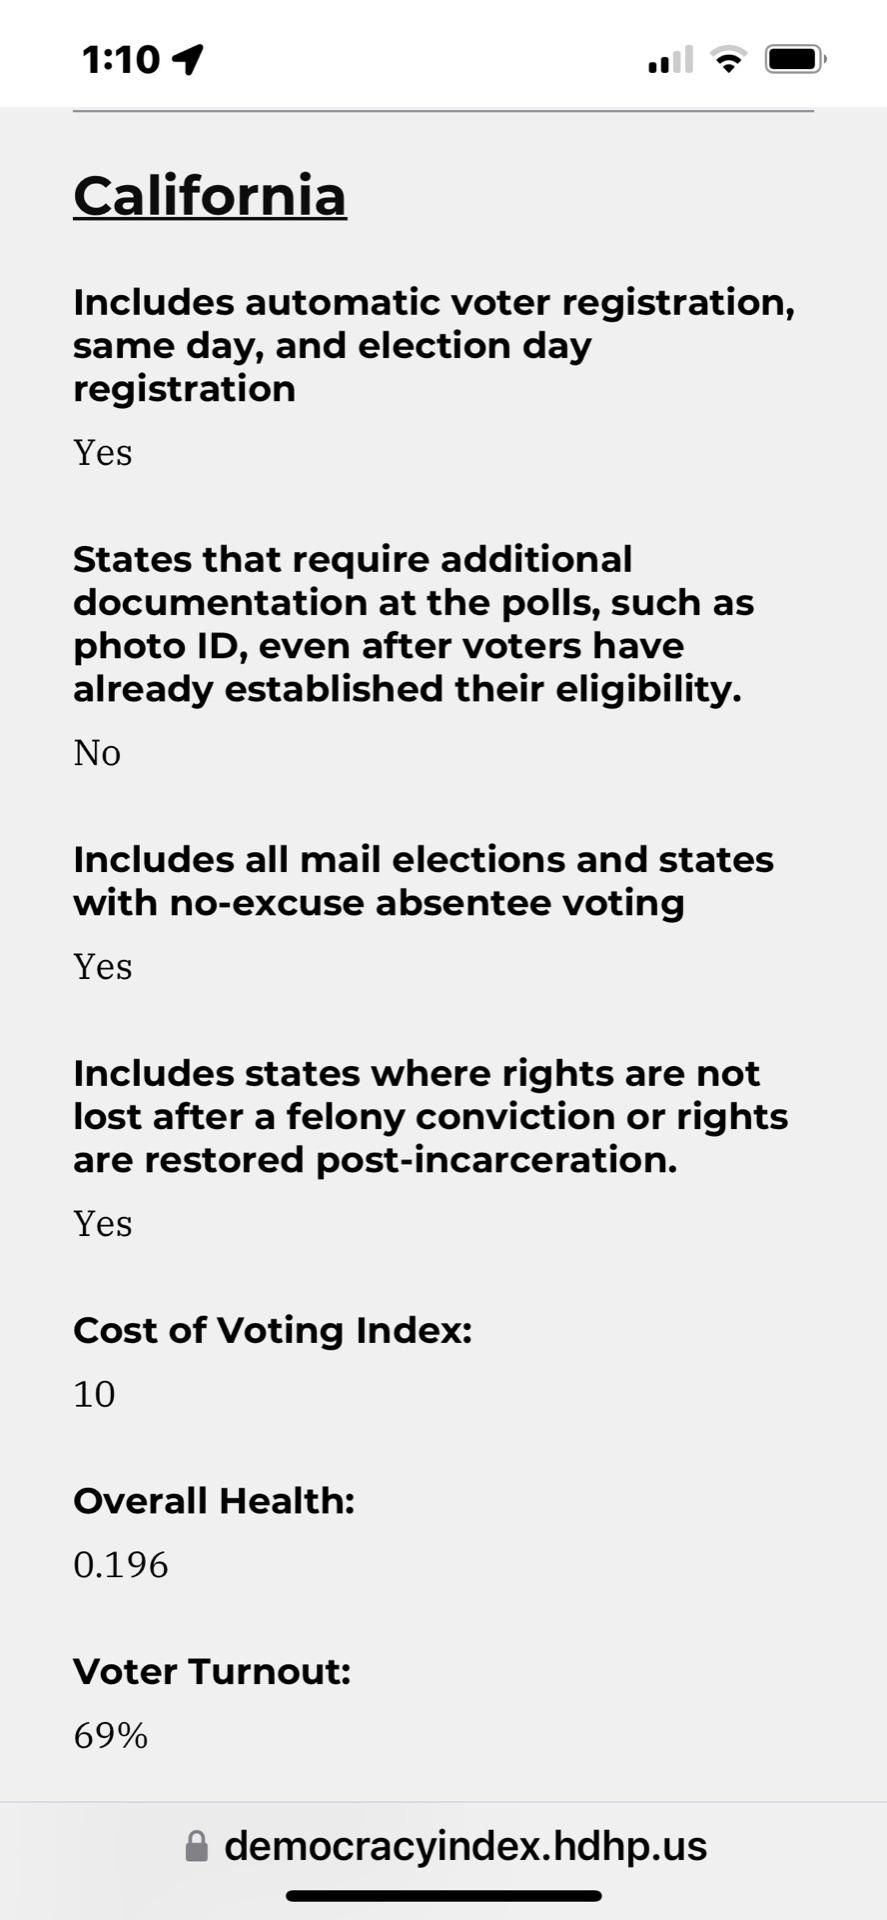
Here are the ratings for California, with 39 million population:

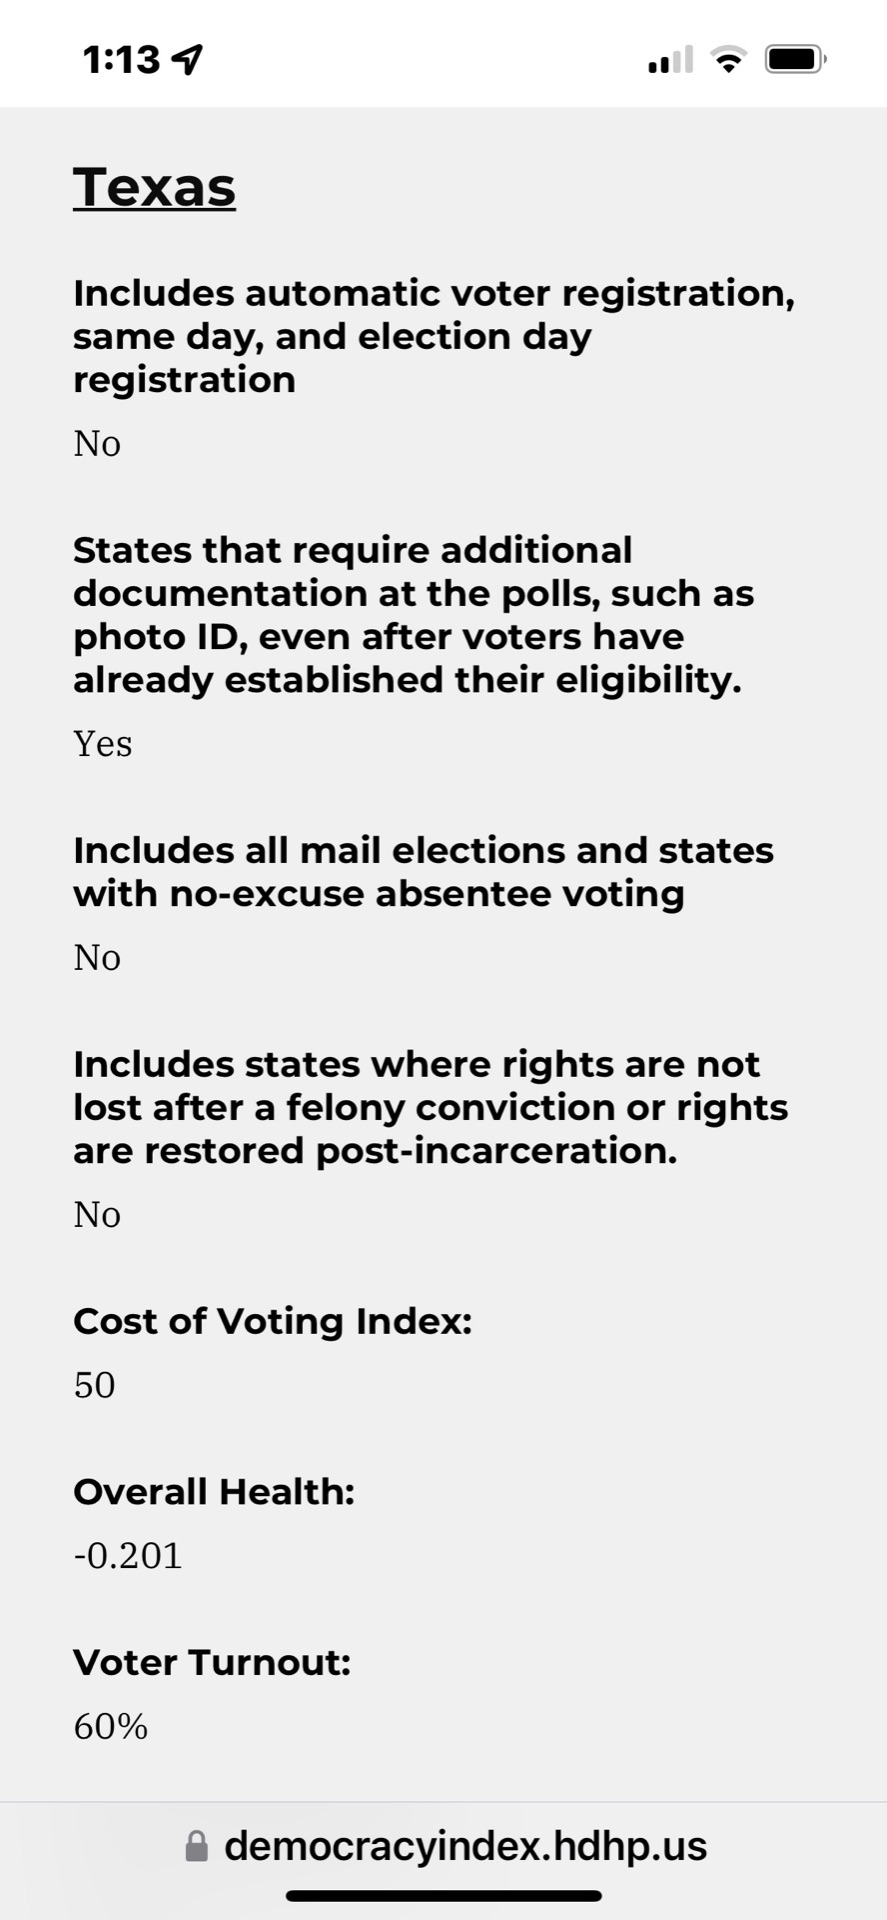
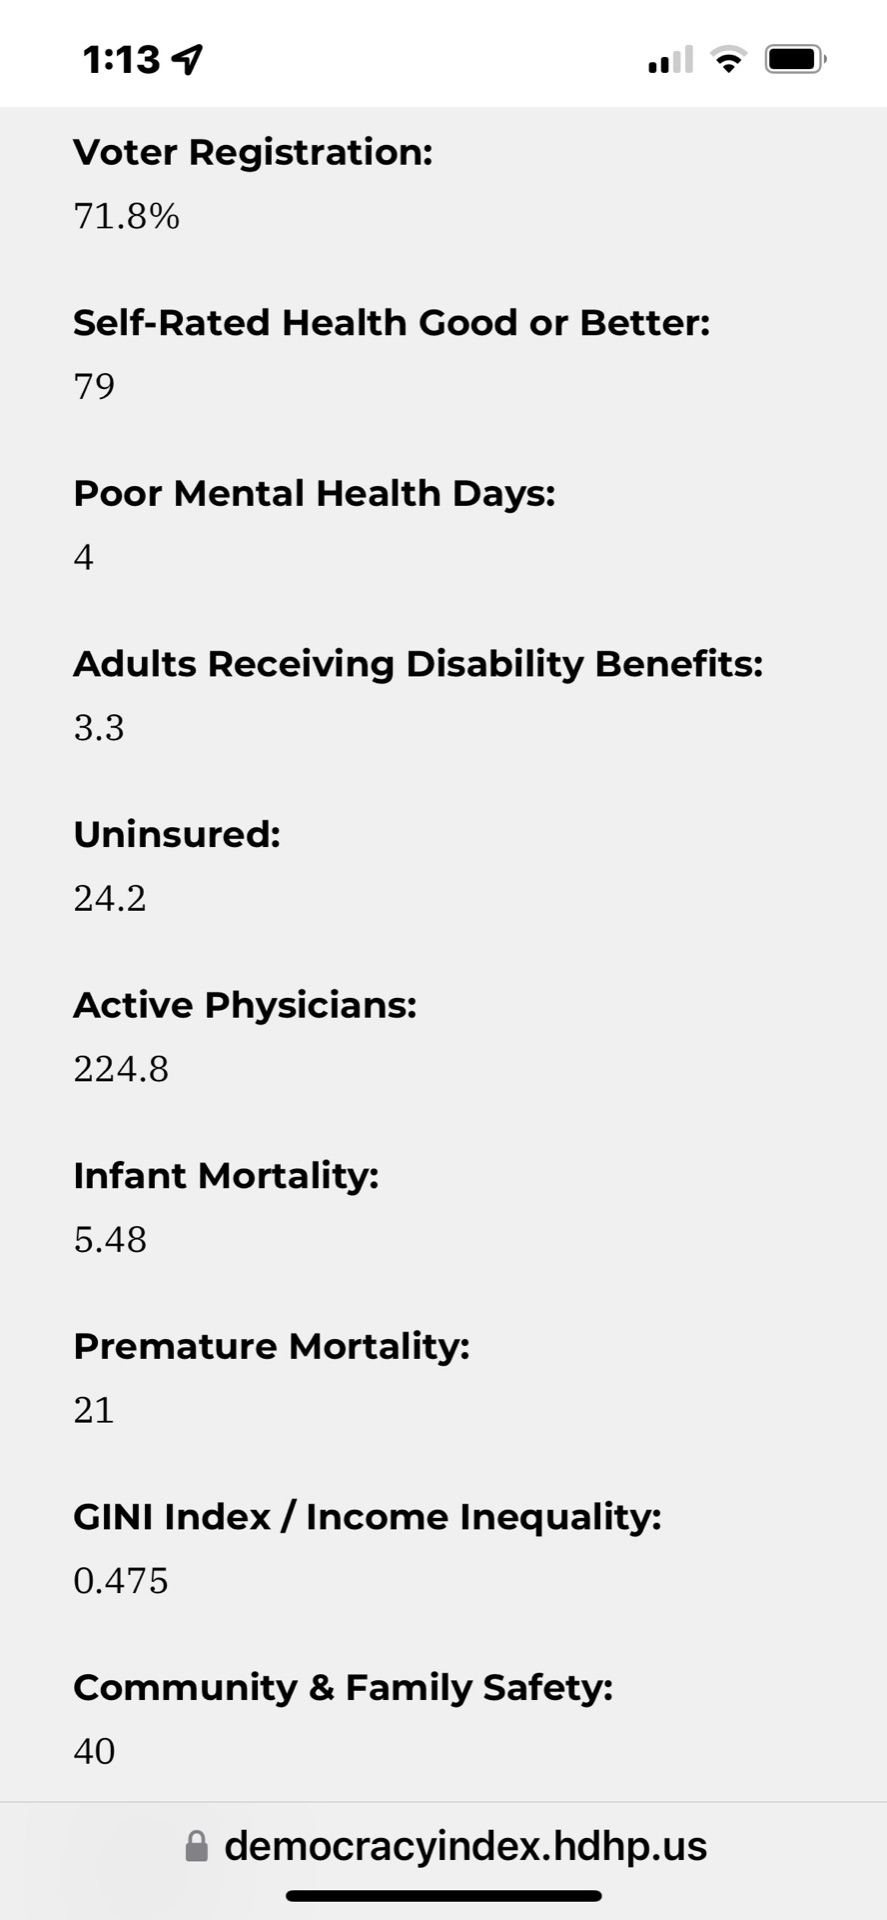
Here are the ratings for Texas, with 28.6 million population:
Here are the categories for Florida, with population 21.3 million:


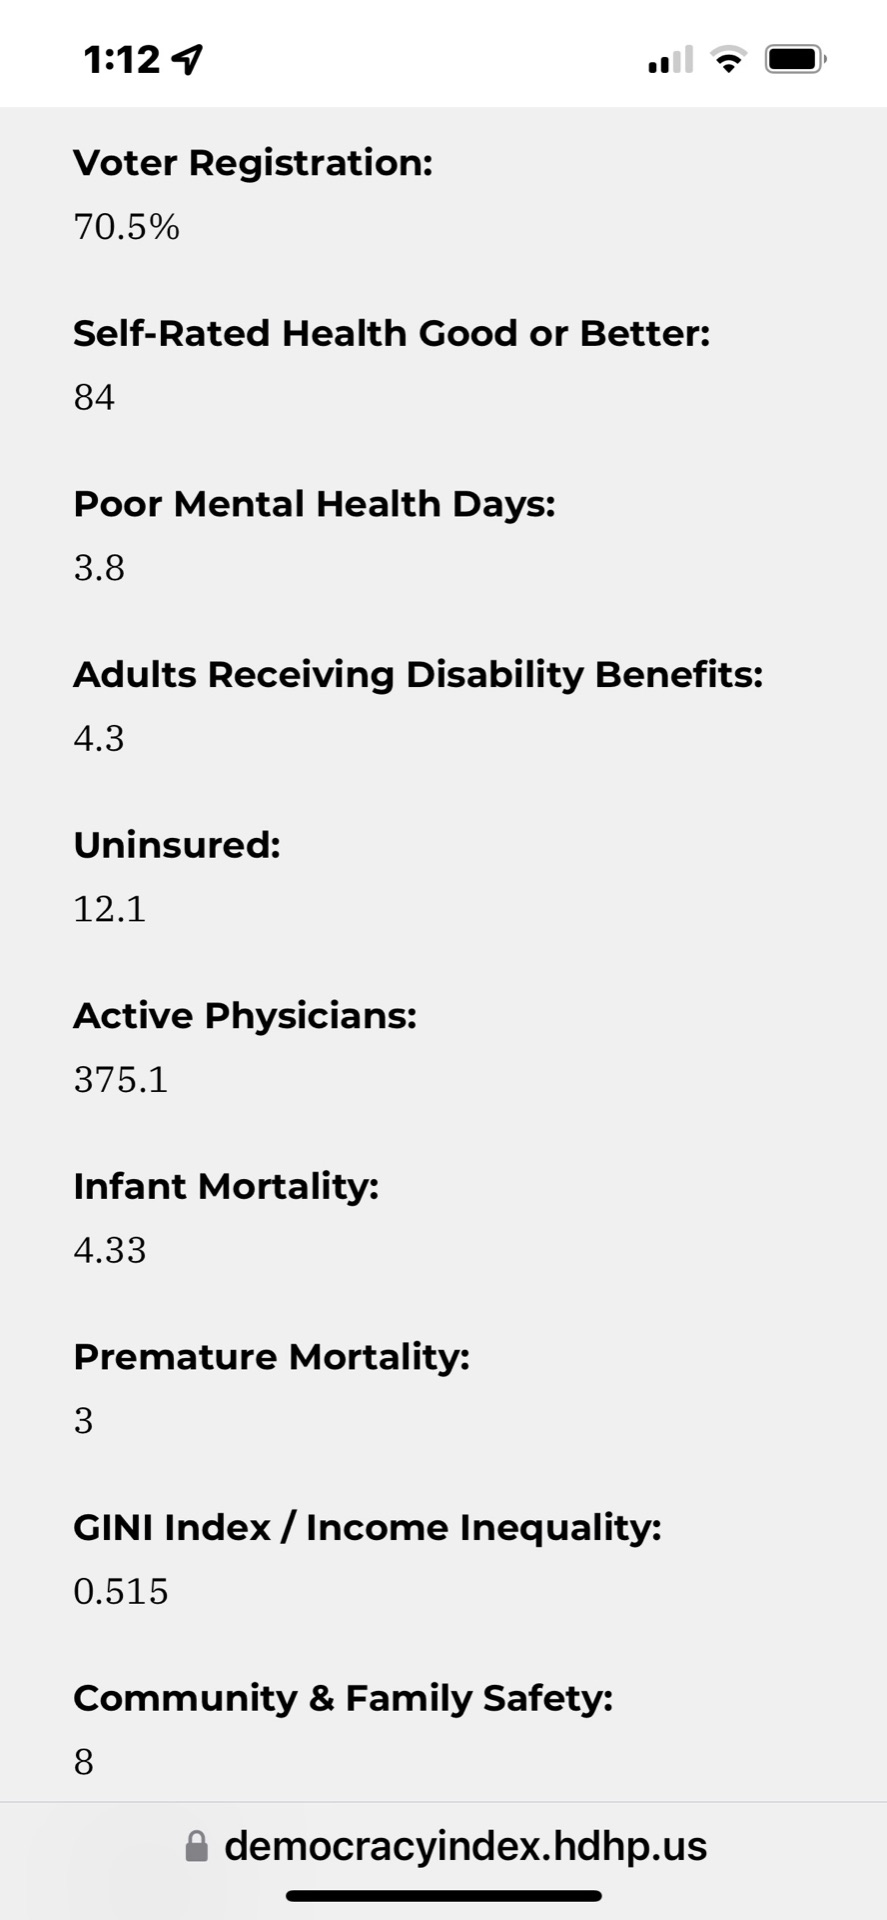
Here are the ratings for New York with a population of 19.5 million:

The Poverty category for the above four states is: CA, 11.4; TX 13.1; FL, 12.3, and NY, 13.3.
The Overall Health index is: CA, 0.196; TX, -0.201; FL, -0.101; and NY, 0.181. The high is NH at 0.723, and Massachusetts at 0.712. The lowest is -0.969 for Louisiana.
The Physicians per 100,000 is: CA, 279.6; TX, 224.8; FL, 265.2; and NY the dominant winner, at 375.1.
The Gini income inequality indexes, where lower is better or more equal, are: CA, 0.487; TX, 0.475; FL, 0.481; and NY, 0.516. The US Gini index is 0.411. Zero would be totally equal, and 1 would be one person owned all.
We’ll just add that the 2019 per capita Real GDP in chained 2012 US dollars is: California, $70,662; Texas, $61,682; Florida, $44,267; New York, $75,131; and the US, $58,107.