
Pretty much steady as she goes. The latest run was using data up to October 18.
Total deaths on February 1 are 1,389,053. Subtracting the model total for October 27 of 1,353,396 gives 35,653 more deaths to go. Again, I keep the exact model numbers just for subtractions and ratios. With 80% masking, the total deaths to go would be reduced by 7,272, saving 20%.
Current masking is only at 8%. Full initial two vaccinations by February 1 are 74%. Most of the new infections are of the BA.5 variant at 75%-89% for all states. Infections of BA.1/BA.2 is 10%-24% for all states. Immunity through infection or vaccination from BA.1/BA.2 variants is 62%, and from BA.5 is 57%. There are graphs for these by states later on. The effectiveness of the Pfizer vaccine against severe disease by Omicron is modeled at 72%, and against infection is 44%. The effectiveness of the Moderna vaccine against severe disease is 73%, and against infection is 48%, quite similar to the Pfizer effectiveness.
Total Deaths per day in the model on October 27 are 382, of which 303 are reported. Total Deaths will slightly dip, and then increase to 435 per day on February 1, while reported deaths will be at 335 per day. With 80% masking, Total Deaths per day would be 319 per day on February 1, or 73%.
Hospitalizations on October 27 are modeled at 24,152, including 2,783 in ICUs, or 11.5%. On February 1, these would be about the same at 25,790, with 3,028 in ICUs, or 11.7%.
Estimated Daily Infections on October 27 are modeled at 762,557 per day, which will increase to 1,011,810 per day on February 1. With 80% masking, this could be reduced to 80% of those, or 812,360 per day. The infection fatality rate is less than 0.2%.
Here is their map by states of Reported and modeled Total Deaths per 100,000 population. The projection for February 1 is that US Total Deaths will be 417 per 100k. It is currently at 408 per 100k.
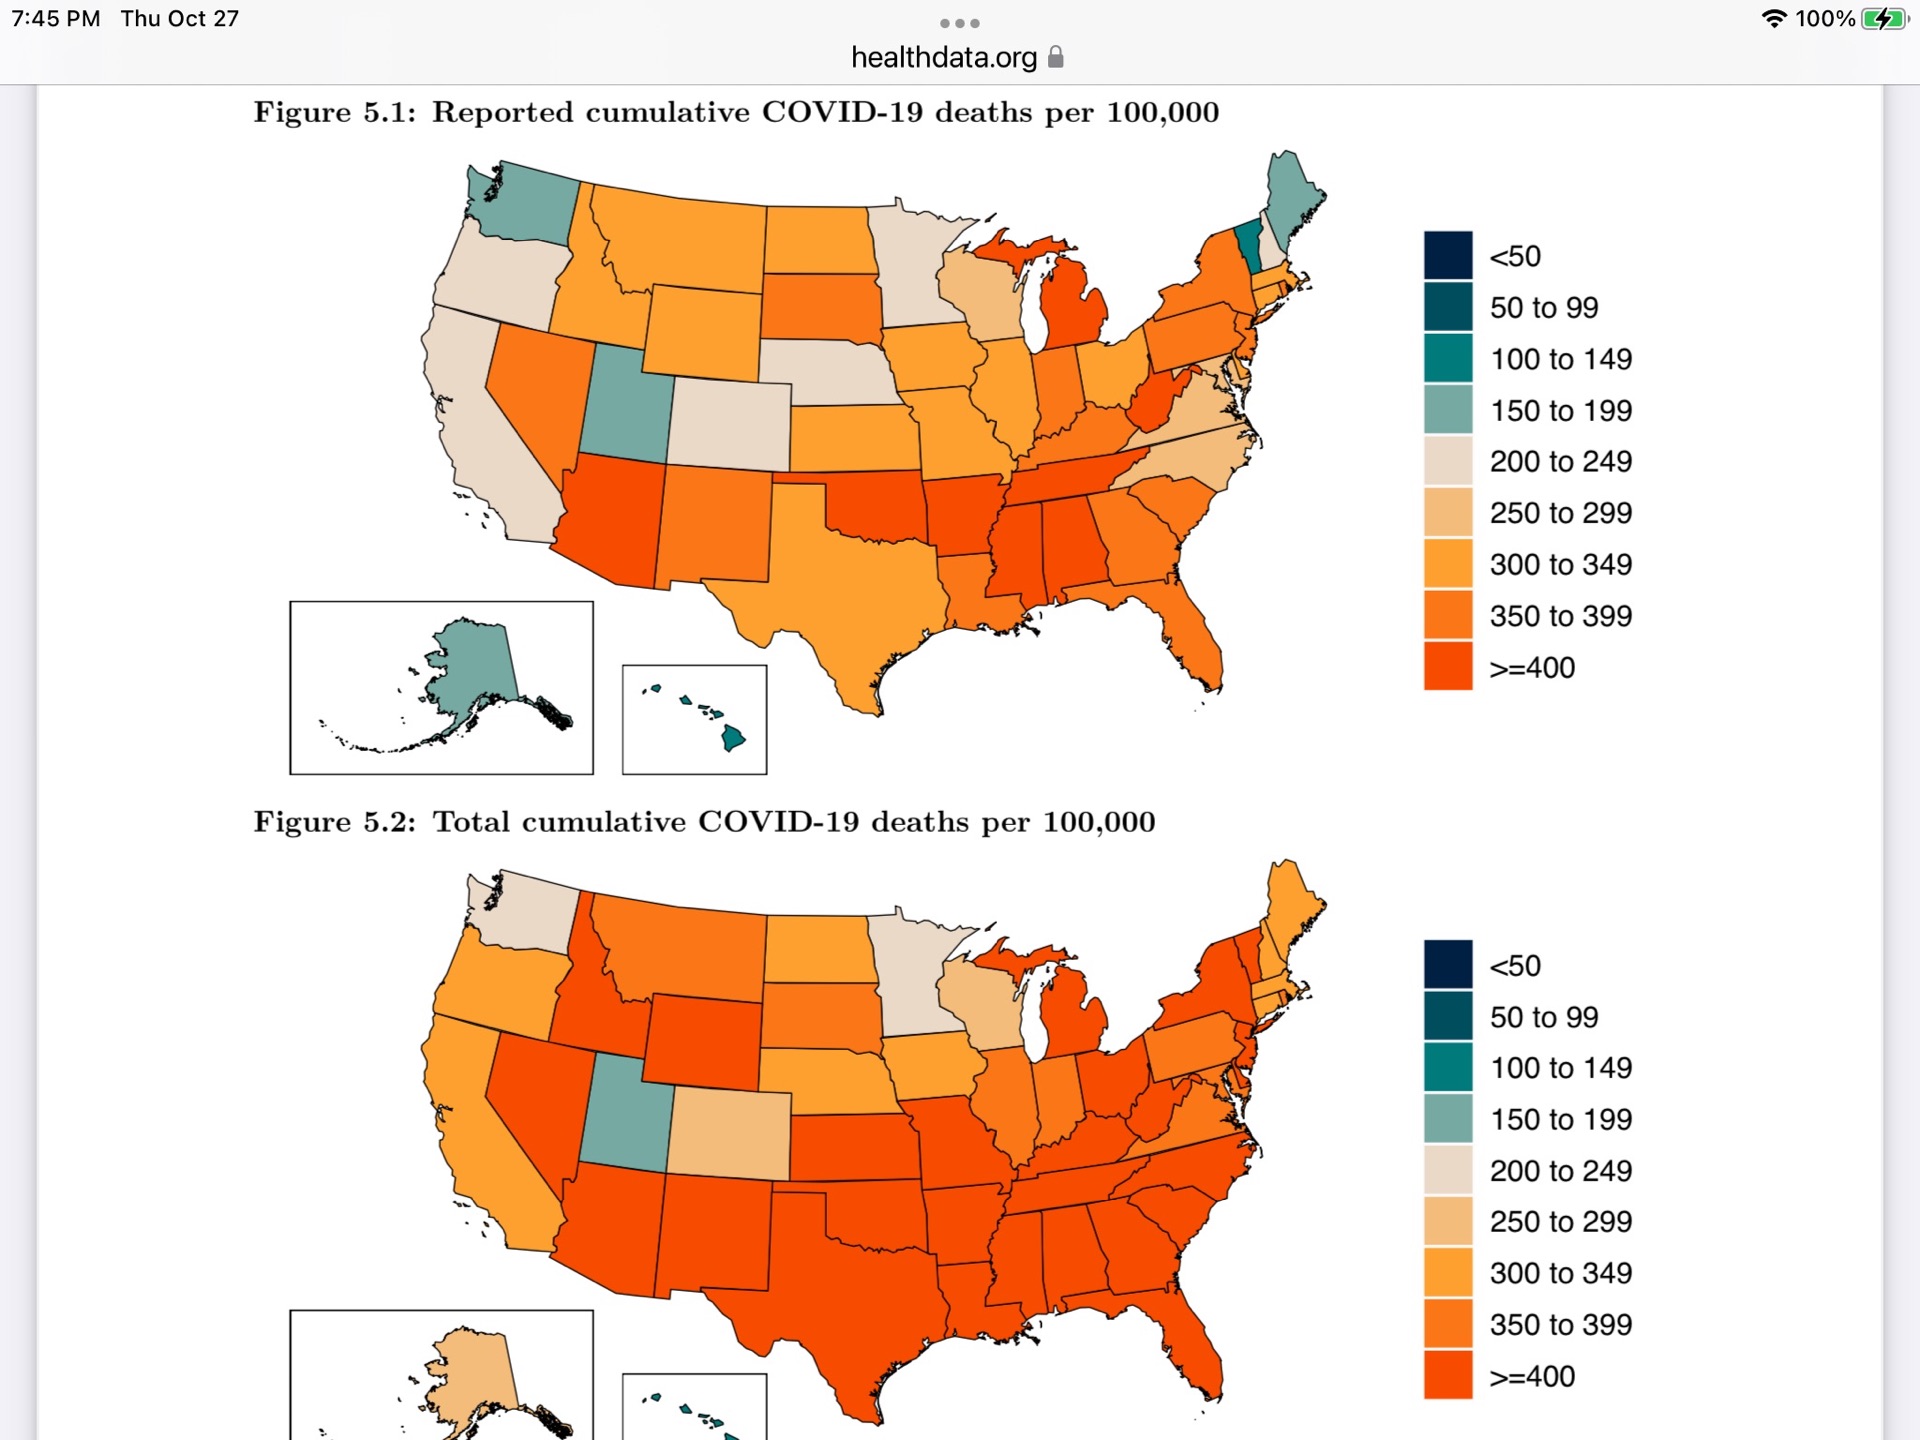
Southern states are mostly >= 400 per 100k. California and others are 300-349 Total Deaths per 100k, while Reported deaths are 200-249 per 100k. Washington and Wisconsin are exceptionally good at 200-229 Total Deaths per 100k.
Below are the maps by states of those who received one or two of the first vaccines. Now, we have a one shot bivalent booster vaccine which covers the original Covid and the omnipresent BA.5 Omicron variant. Only about 6% of the US population has gotten it so far.

Again, some southern states are content with 50%-60% fully vaccinated.