Laguna Beach Marine Layer Solar Suppression from National Renewables Energy Lab Data.
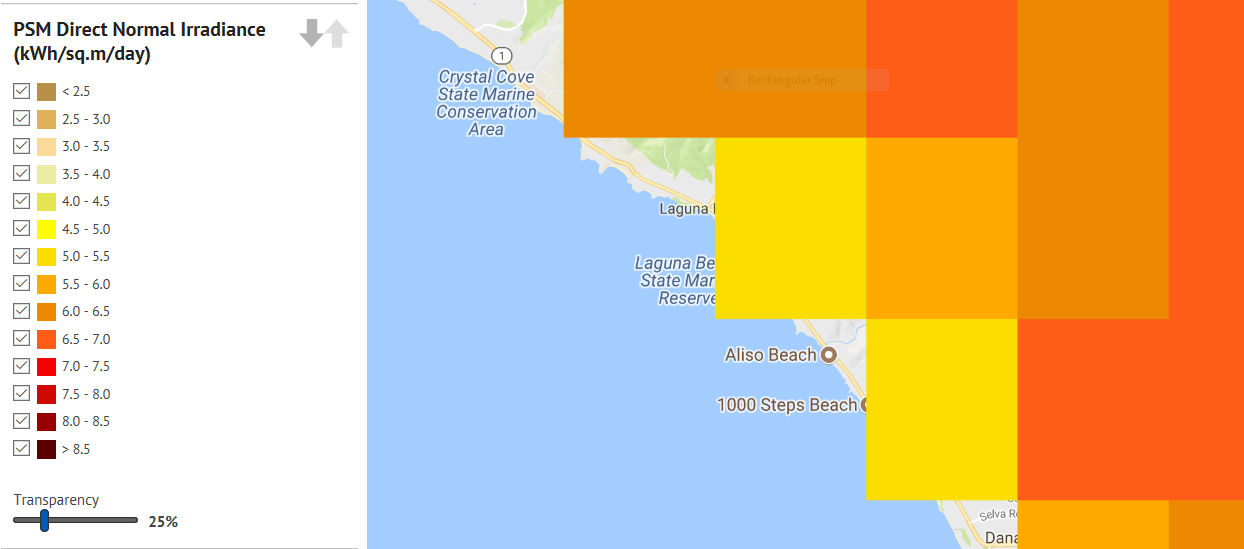
The NREL climate data shows the normal irradiance in kilowatt hours per square meter per day for the coastal area including Laguna Beach. Laguna beach is a slightly anomalous area in getting the lowest average sunlight in the range of 4.5-5.0 kWh/sq-m/day, marked by the yellow squares. Next inland is the tannish 5.0-5.5 square, followed by the brown 6.0-6.5 rectangles. More inland is the orange 6.5-7.0 kWh/sq-m/day region.
The depression at Laguna Beach could be roughly taken as 4.75/6.75 = 70%, so the irradiance is about 30% lower than the further inland area. This is roughly in agreement with the 64% percent possible sunshine in the data of the previous article in this blog for May and June, and 70-84% during the rest of the year.
Much further inland at the desert areas, the irradiance is mostly in the 8.0-8.5 kWh/sq-m/day red area, where most of the utilities have their solar plants. This means that solar roofs in Laguna Beach itself are about 70% as efficient as the solar farms used by the utilities.