
When industry and conservative writers or commentators oppose lowering US greenhouse gas (GHG) emissions, they always point out that China’s are now higher than US emissions, and they are supposedly doing nothing about it, and throw in India as third. They imply that India’s GHG emissions must be somehow be comparable to China’s or the US’s. Data really throws ice cold water on that characterization of India’s GHG emissions.
The worlds GHG emissions total 32.7 trillion metric tons as of 2012 in EIA data. In those units, China’s are 8.55, or 26.1%. The US has 5.27, or 16.1%. India, at third, has 1.83 or 5.6%. The industry commentators say if the US is only 16%, we should just do nothing since it is so small an amount, and China’s are larger. But they also throw in India, which is only 40% of the US’s, and 21% of China’s. Of course, in the future India may be able to industrialize and raise their standard of living, and will grow larger in GHG emissions, but that is not the case now.
We also note in comparison by countries, that India is only slightly larger than Russia at 1.78 versus India’s 1.83, or Russia’s 5.44% versus India’s 5.60%.
Another way that India looks small is in comparing regions of the world. Europe emits 4.26 of GHG, or 13.0% of the world. That is close to the US emissions, and 2.3 times that of India’s.
Finally, we compare countries and Europe by emissions per capita. Among large countries, the US is the clear leader (cheers) at 14.1 metric tons per capita, PER YEAR. (Aren’t we glad that CO2 is a gas, and not an ash mountain that we have to haul away every month.) The world average is 4.63 metric tons per capita. Russia is next at 12.0, and Japan at 9.42. Next is the Middle East at 9.02, and Europe at 7.12, about half of the US. China comes in at 6.05. Last comes Africa at 1.11, but a close runner up to last is India at 1.47. So the US per capita emissions is 9.6 times the per capita emissions of people in India. That is, a person in the US has a share of ten people in India. This has never been pointed out by industry or conservative commentators. The per capita GHG for India is even only a third or 32% of the world average.
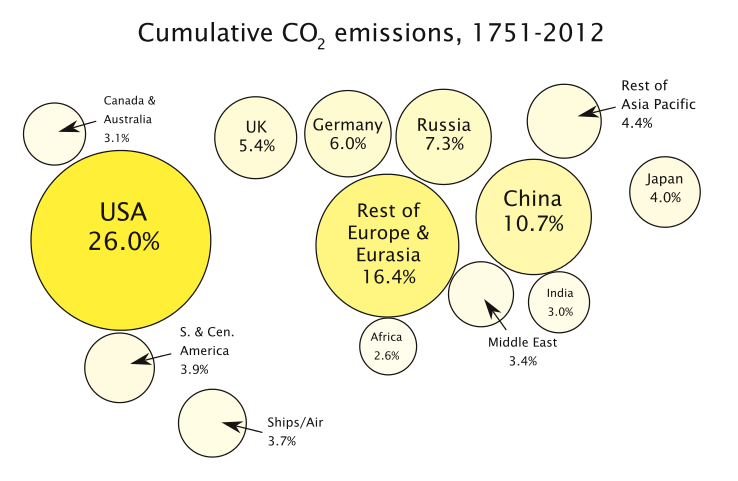
Since most energy related CO2 produced is still in the atmosphere warming the earth, we can look at the sum produced by each country or region. A lot of the emissions was produced in constructing the infrastructure and wealth that the leading countries enjoy. Of course, since China has only recently become a major producer, the US still leads in the total CO2 produced, at 26%. China is second as a country at 10.7%, only 41% of the US achievement. India at 3.0%, is next to last on this picture graph, only exceeding Africa at 2.6%. India’s total emissions are only 12% of the US’s.
Continually throwing in India with the US and China as comparable in emissions is sorely misleading. Leaving out Europe and Russia is also really not backed up by the data.
Expecting and watching China’s GHG lowering programs is very interesting, but apparently not followed by conservative commentators. China has programs in closing old coal plants, planning tens of nuclear plants, building and planning hydro power, leading in solar power production and usage, and importing natural gas.