
We show indicators relevant to Universities from the National Science Board 2018, Science and Engineering Digest, NSB-2018-2, Alexandria, VA; National Science Foundation. This is available at https://www.nsf.gov/statistics/digest/ The graphs given there are much fancier than here, in that you can point to a year and get the exact numbers.
We start with research university funding from state and local sources, versus tuition:

We see that from 2000 to 2015, the per student funding from state and local sources has dropped from $14,000 per year to about $9,000 per year, or about a drop of one-third. At the same time, tuition has doubled, from about $6,500 to almost $13,000.
Published S&E articles from principal countries and the EU:
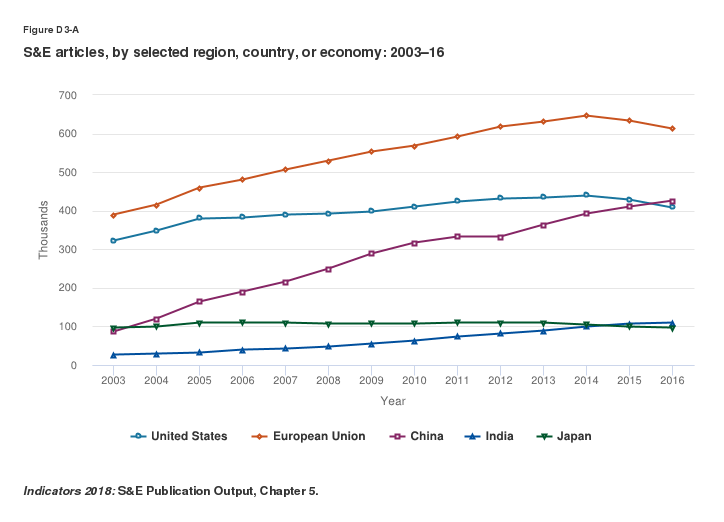
We note that the EU population is 512 million people. The US population is 325 million, so the EU is 1.58 times the US population. EU publications are about 600,000 a year, compared to US publications at about 400,000 a year. This is about a 50% EU lead, about consistent with the population excess, so no panic. China has caught up with the US, with a population of 1,410 million. We congratulate China for its great and continuing strides. India, with 1,339 million, has matched Japan, with 127 million, at about 100,000 publications a year.
Bachelor’s S&E degrees in leading countries and the EU.
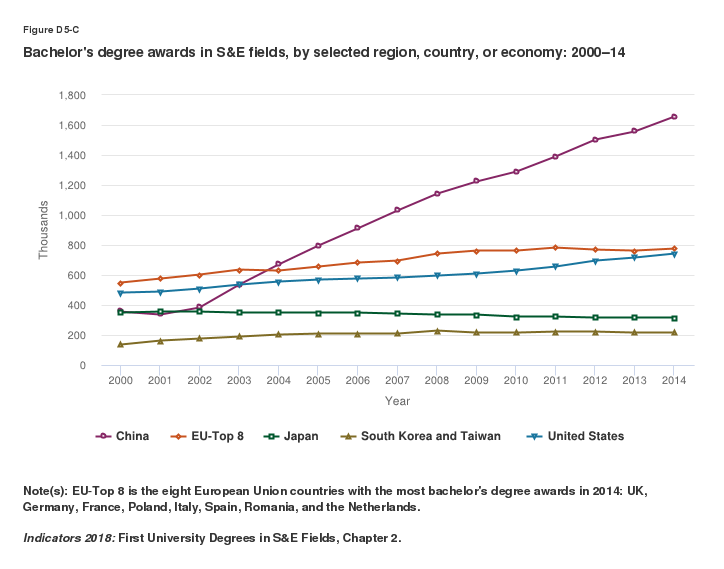
China has a strong lead with 1.65 million S&E degrees. There used to be discussions as to whether a lot of these were just technical degrees, but in either case, they are still valuable resources. The EU-Top 8 and the US are about equal at 800,000 bachelors a year in S&E. Japan has over 300,000, and South Korea with Taiwan about 200,000. The sum of these leading countries is about 3 million S&E degrees a year.
Doctoral S&E Degrees in leading countries and the EU.

EU-Top 8 produces about 60,000 doctoral degrees in S&E a year. The US citizens and permanent residents produce about 40,000. The US also gives doctoral degrees to temporary visa holders. China produces about 35,000 a year. Japan, and the combined South Korea and Taiwan, each produce about 10,000 a year. The sum of these leading countries is about 145,000 a year.