
One key way to measure the danger of extreme temperatures is to count the number of days in a year when the temperature reaches 90º F or higher. The Climate Impact Lab (impactlab.org) did this for the New York Times. They made a database that for major cities would show the yearly count of the number of days in which 90º F was reached. The record starts in 1960 and runs until 2017. Then they projected this for the cities until 2089, or essentially, the end of this century. The Climate Impact Lab researches many impacts of Climate Change, and is a collaboration of UC Berkeley, the Energy Policy Institute of the University of Chicago (EPIC), the Rhodium Group, and the Rutgers University Institute of Earth, Ocean, and Atmospheric Sciences.
They assume that in the future that the cuts in greenhouse gas emissions according to the Paris Accords will be met. These accords are not often being met, and are insufficient anyway, and will be increased shortly. Only about half of the US is committed to meeting the accords. Nationally, the Trump Administration is doing everything that it can to reverse the commitments of the Obama Administration, as well as planning to withdraw the US from the Paris Agreement as soon as possible, in November, 2020. The US is the second largest emitter of Greenhouse Gases at about 10% of the world total, behind China, at about 20%.
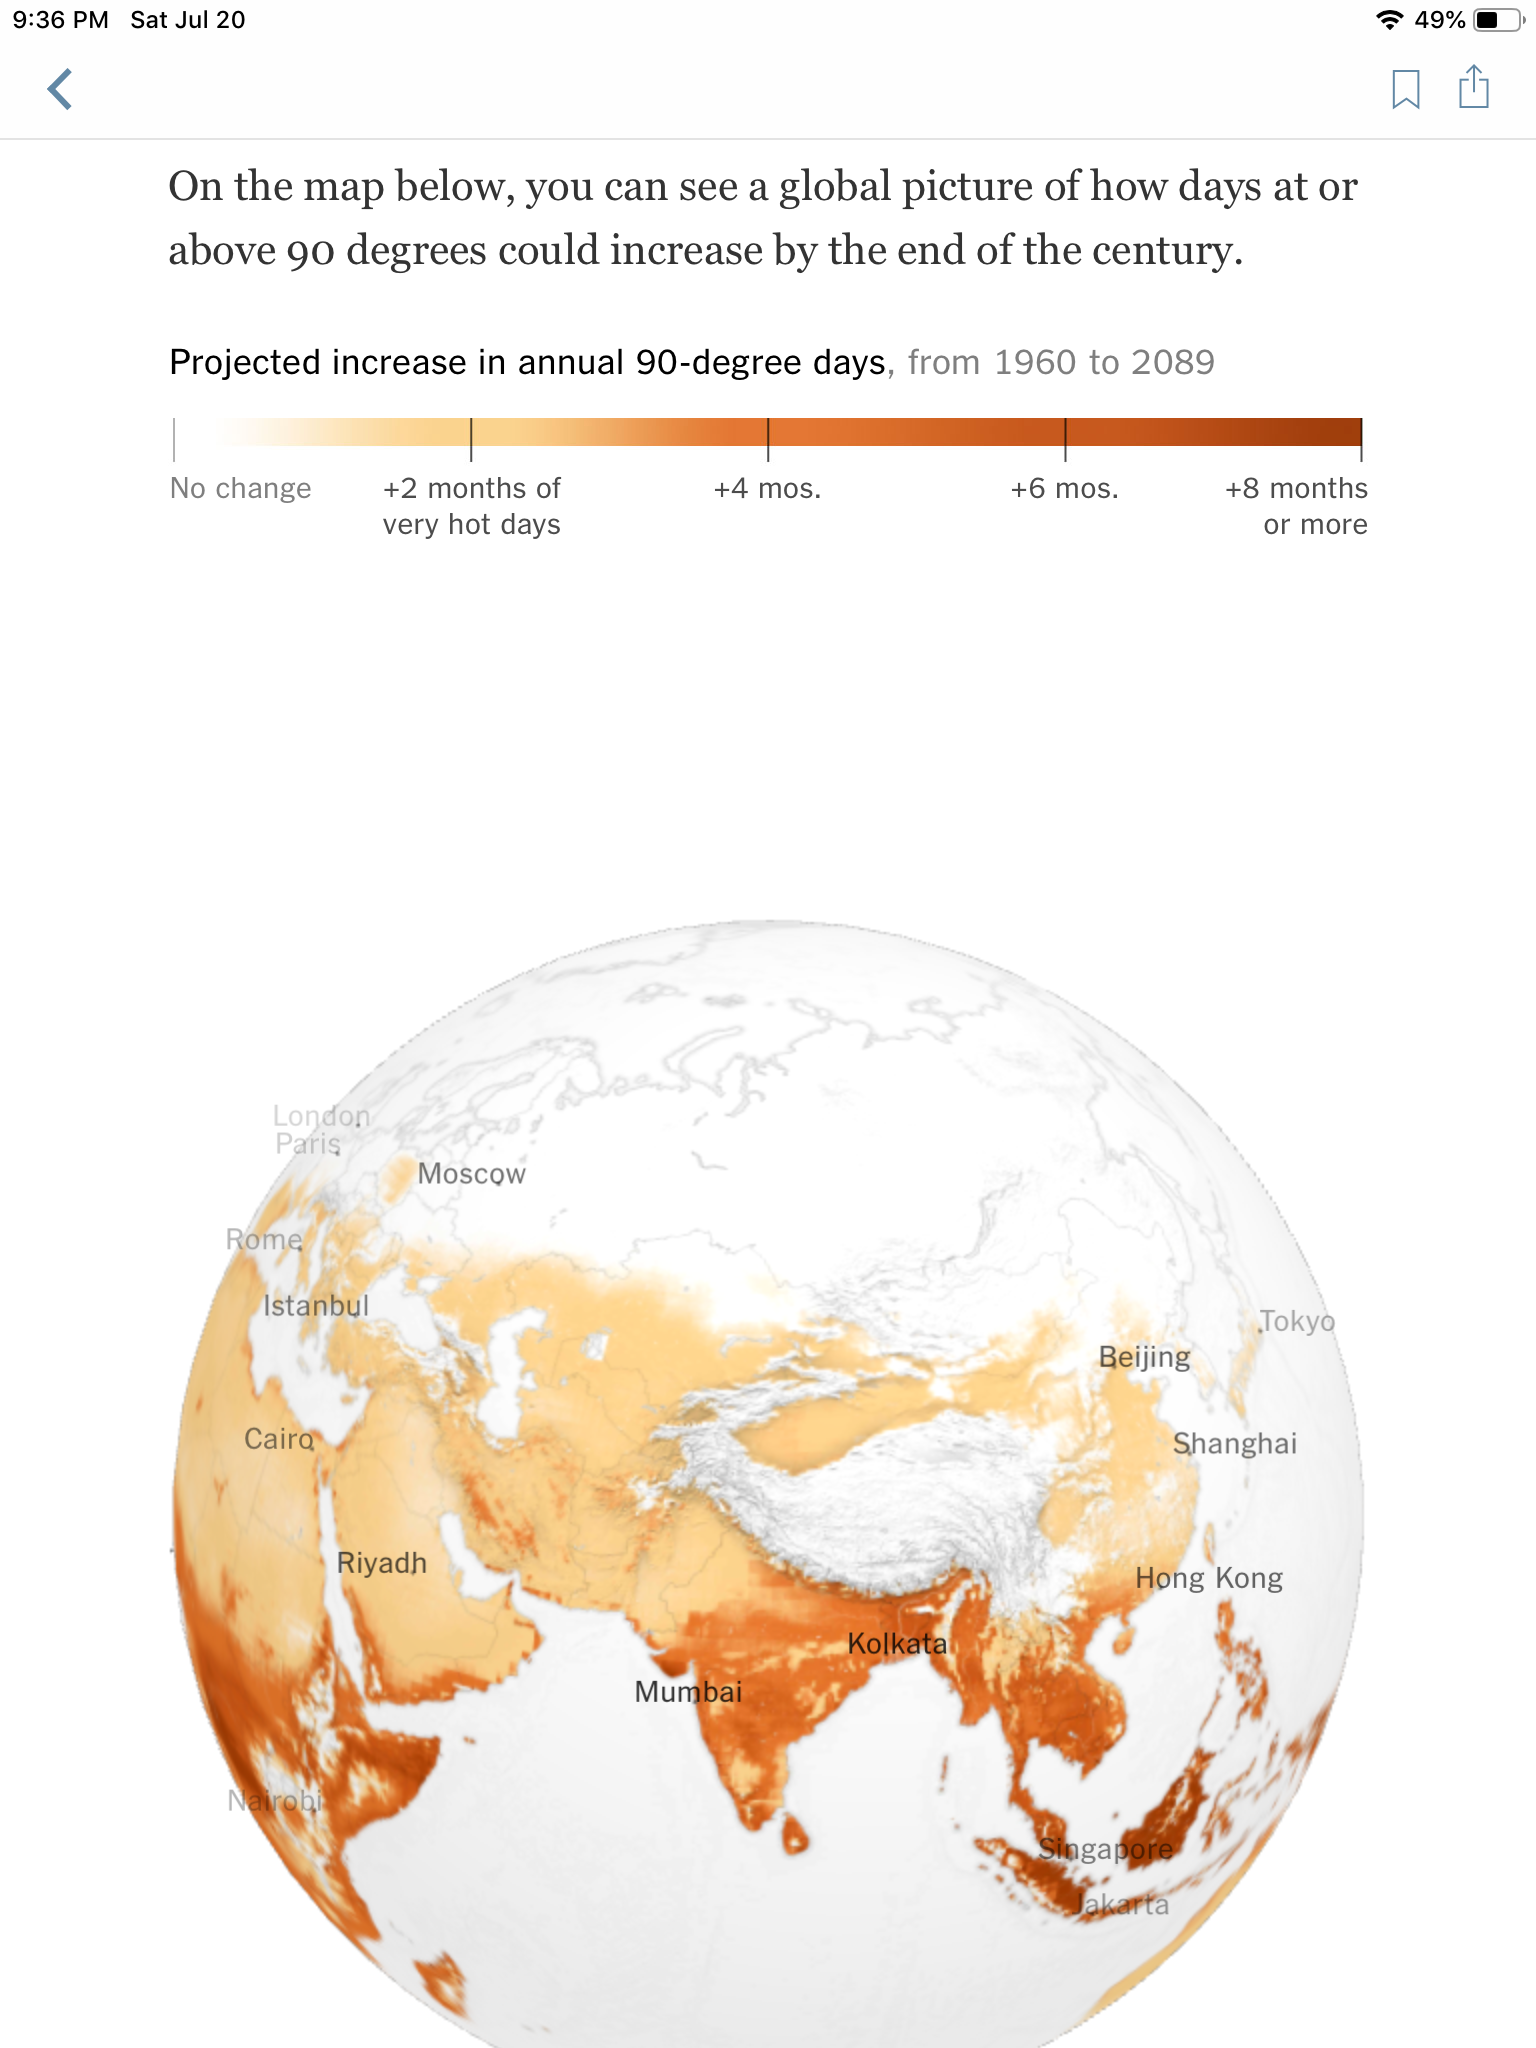
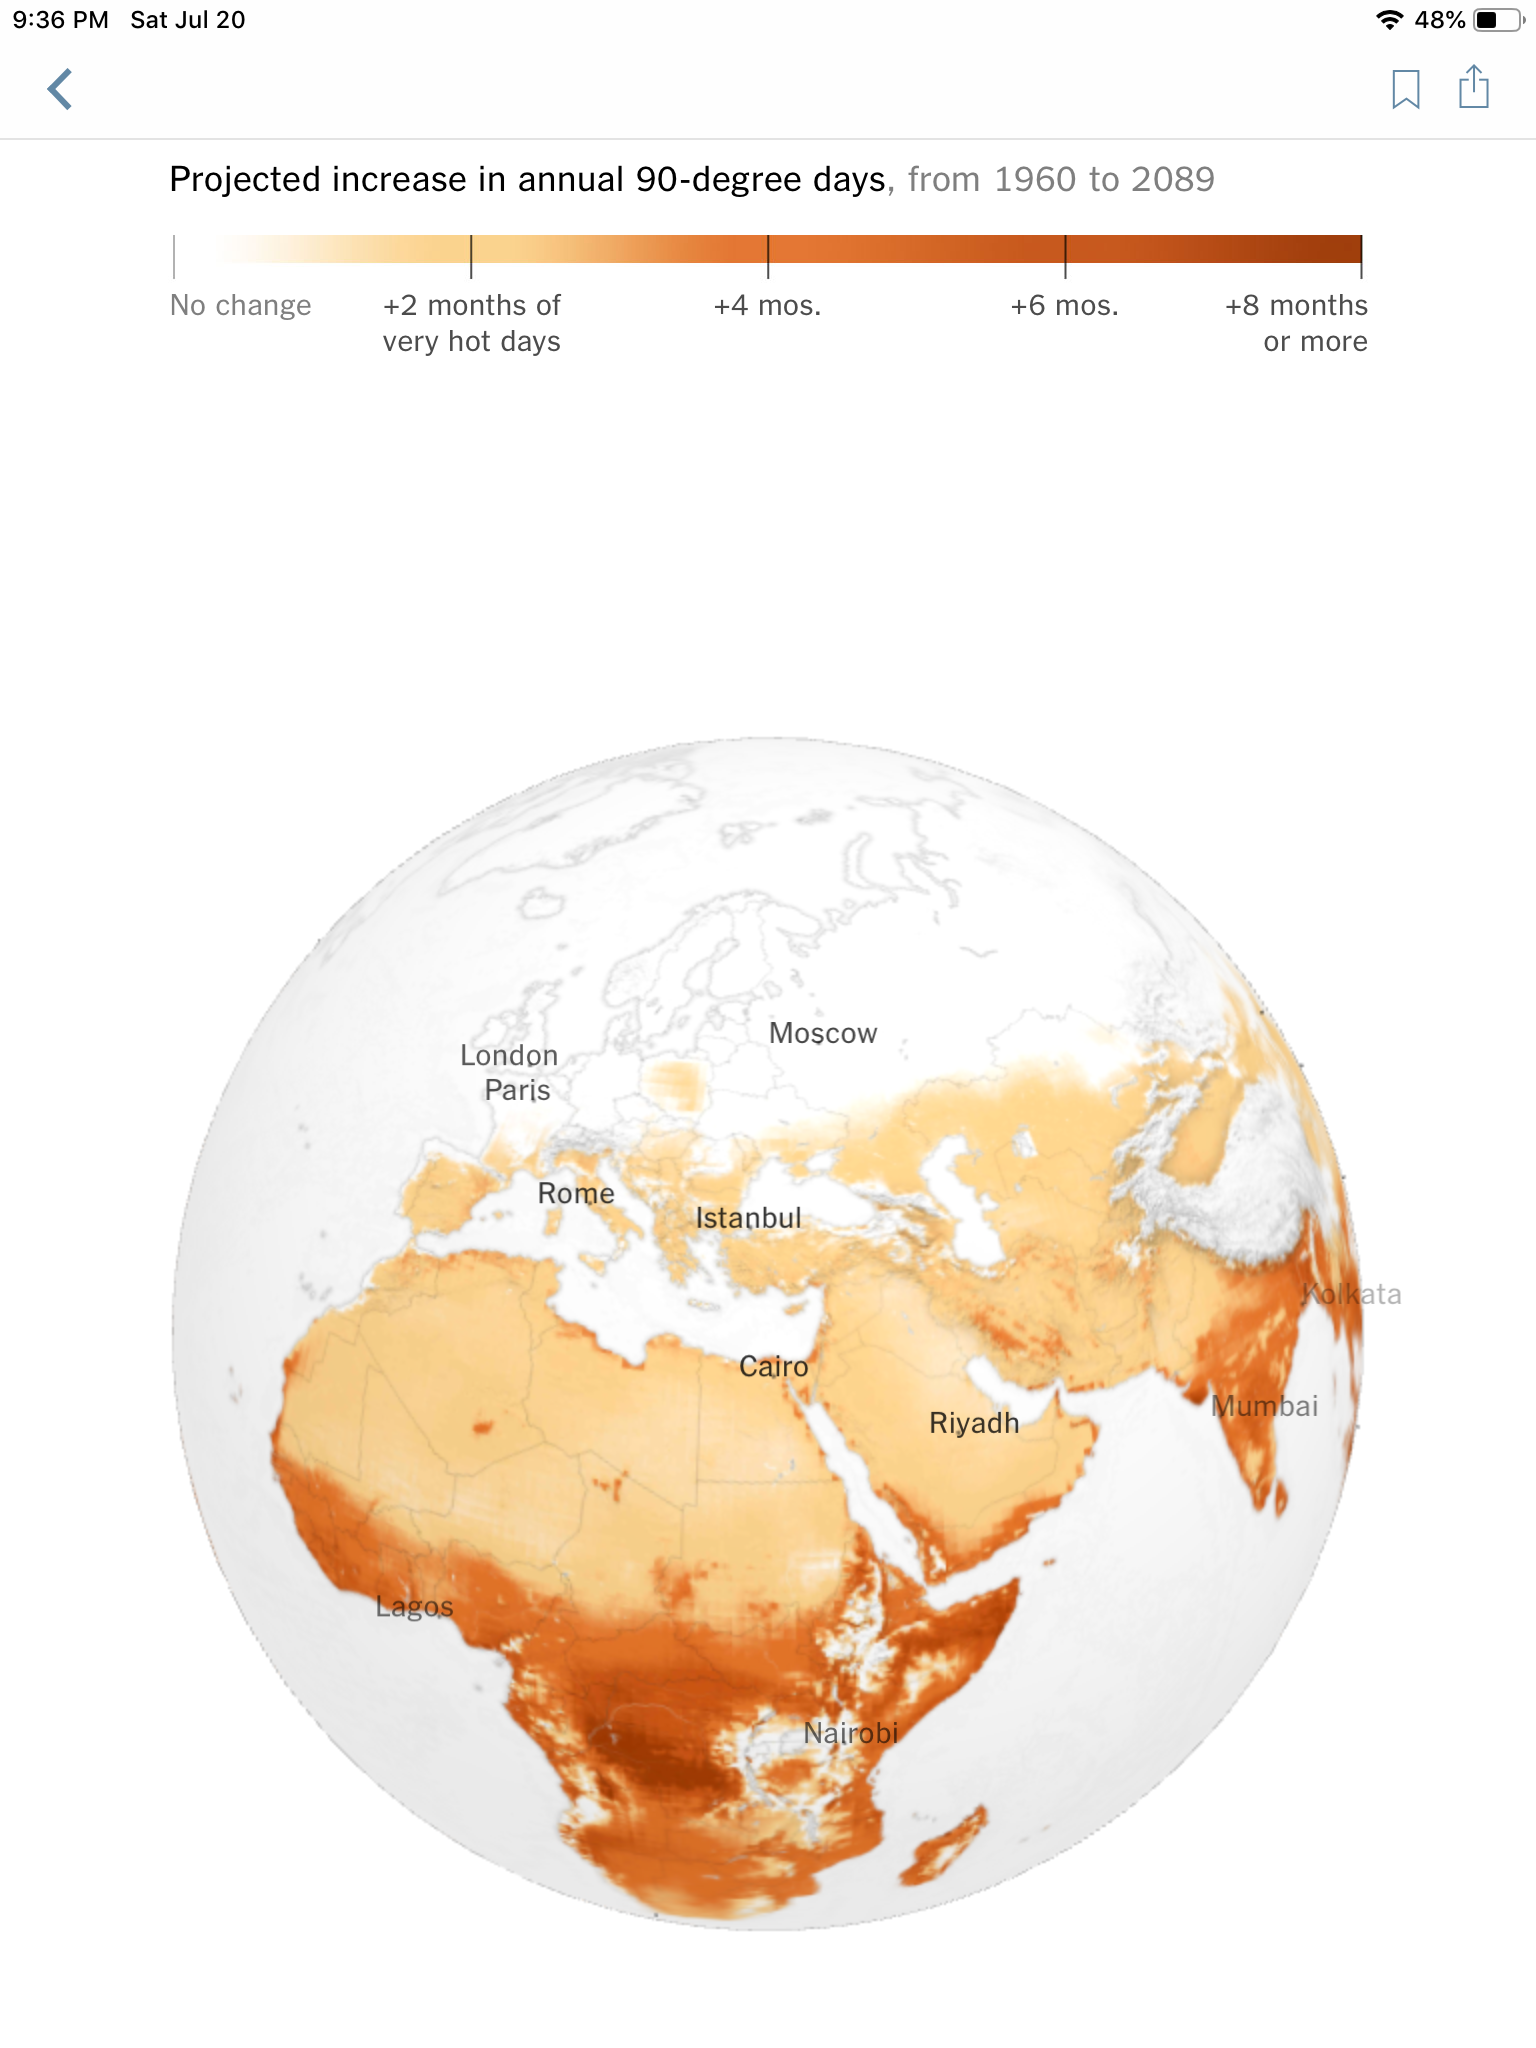
In this article we show the record and projected high temperature counts for several US and World Cities. We also show the world maps, where the largest increases in count are for the Southern Hemisphere, and the Southern cities of the Northern Hemisphere. Since the record does not go back to my actual birthday, I entered a birthday as 1990 in the graphs, midway between 1960 and the present. Here is the New York Times link. I will someday have more graphs on my Flickr account, when some mischegas gets straightened out. Below is the record and projection for 90º days for Los Angeles, California.

The Los Angeles record of 90º F days per year starts in 1960 with about 56. By 2017 it was 67 days. In 2050 it centers about 85 days, and in 2089 it reaches 94 days/year. In the latter day, the error about 94 ranged from 86 to 103 days/year. In 2089, there were a rise from 67 days in 1960 to 94 days in 2089, or a gain of 27 days/year or 40%
We now show three views of the world globe, from the Climate Impact Lab, with areas of increased days at 90ºF. Very red is a remarkable increase of 8 months or more of 90º days. At 30 days/month, it would be an increase of 240 90º days from 1960 to 2089. Indonesia gets into dark red. Lighter red of a 6 month or 180 days of added 90º days covers Southern China and Southern India.
The next globe shows Southern Africa in regions of 6 to 8 months of increases in 90º days/year.
The last globe shows the 6 and 8 months of 90º days/year increase over the Northern half of South America.

In our coverage of individual cities, we of course have to start with the nation’s Capitol, Washington D.C. This started with 8 90º days in 1960. It has risen to 30 days at present. The model has it crossing 50 days in 2050, and has it reaching 55 days in 2089, with error bars ranging from 35 to 67 days/year.
Our President’s Southern White House is near Miami, Florida. Starting with 85 90º days in 1960, it has risen to 135 days today. In 2089, this rises to about 165 90º days/year. This is an increase of 80 days/year since 1960, or an increase of 94%.
Another Southern US city is Dallas, Texas. It starts with about 98 90º days in 1960, falls to 90 days for the ‘70’s, and rises to 107 days at present. The projected 90º days rise to 128 by 2089. The rise of 30 days/year from 98 in 1960 is an increase of 31%.
Phoenix, Arizona, started out with 154 90º days in 1960, rising to 168 in 2017. It is projected to about 183 days in 2089.
We now go to the Southern Hemisphere, and only give the number of 90º days projected to 2089. In Mumbai, India, it is about 315. In New Delhi, India, it becomes 232 90º days/year. In Cairo, Egypt, it is 189 days/year. In Rio de Janeiro, Brazil, it is about 135 days/year.
The projections are based on the RCP 4.5 intermediate climate forcing projections. The use of 2089 is because the projection is taking a 21 year average around a given date. The 2017 value includes half a projection over the next 10 years.
While this article was stimulated by the heat wave across the south and east US of last week, that has cooled off into thunderstorms. Oddly, we decided to take our vacation in Sacramento, and are facing temperatures during the next three days of 97º, 100º, and 99º. We’re leaving before the weekend, which will be 104º and 105º.