
California’s Vast Lightning Fires and Hazardous Air Pollution
California has had 11,000 lightning strikes and 370 resulting fires, of which 23 are major fires. Over 10,000 firefighters are fighting them. We will show PurpleAir.com maps of the extremely hazardous air pollution over the fire areas. California is also in the midst of a three week heat wave that may be a hundred year event.
Update: Sunday, August 23, 4:30 pm. The LNU and SCU fires are now both about 340,000 acres, or 530 square miles each. Overall California burning is 1.3 million acres, or 2,000 square miles. The CZU fire is at 67,000 acres, and the River fire and the Butte/Tehama/G fires are at 48,000 acres each. 3,500 structures have been damaged or destroyed, and 5 lives have been lost. Over 100,000 have been evacuated. An acre is about the size of a football field. They are expecting more lightning tonight, as well as high wind gusts.
The two largest fires are: the LNU Lightning Complex fire in Napa County, of 131,000 acres; and the SCU Lightning Complex Fire in Contra Costa, Alameda, Santa Clara, and Stanislaus Counties, of 137,500 acres. Converting 640 acres to a square mile, these are complexes of fires spread out over about 200 square miles each.
As of this evening, the total acreage under fire is 500,000, or about 800 square miles. 60,000 people have been evacuated, and 100,000 are under evacuation warnings.
Below are the Sacramento Area on the West, and Lake Tahoe and Reno on the East,
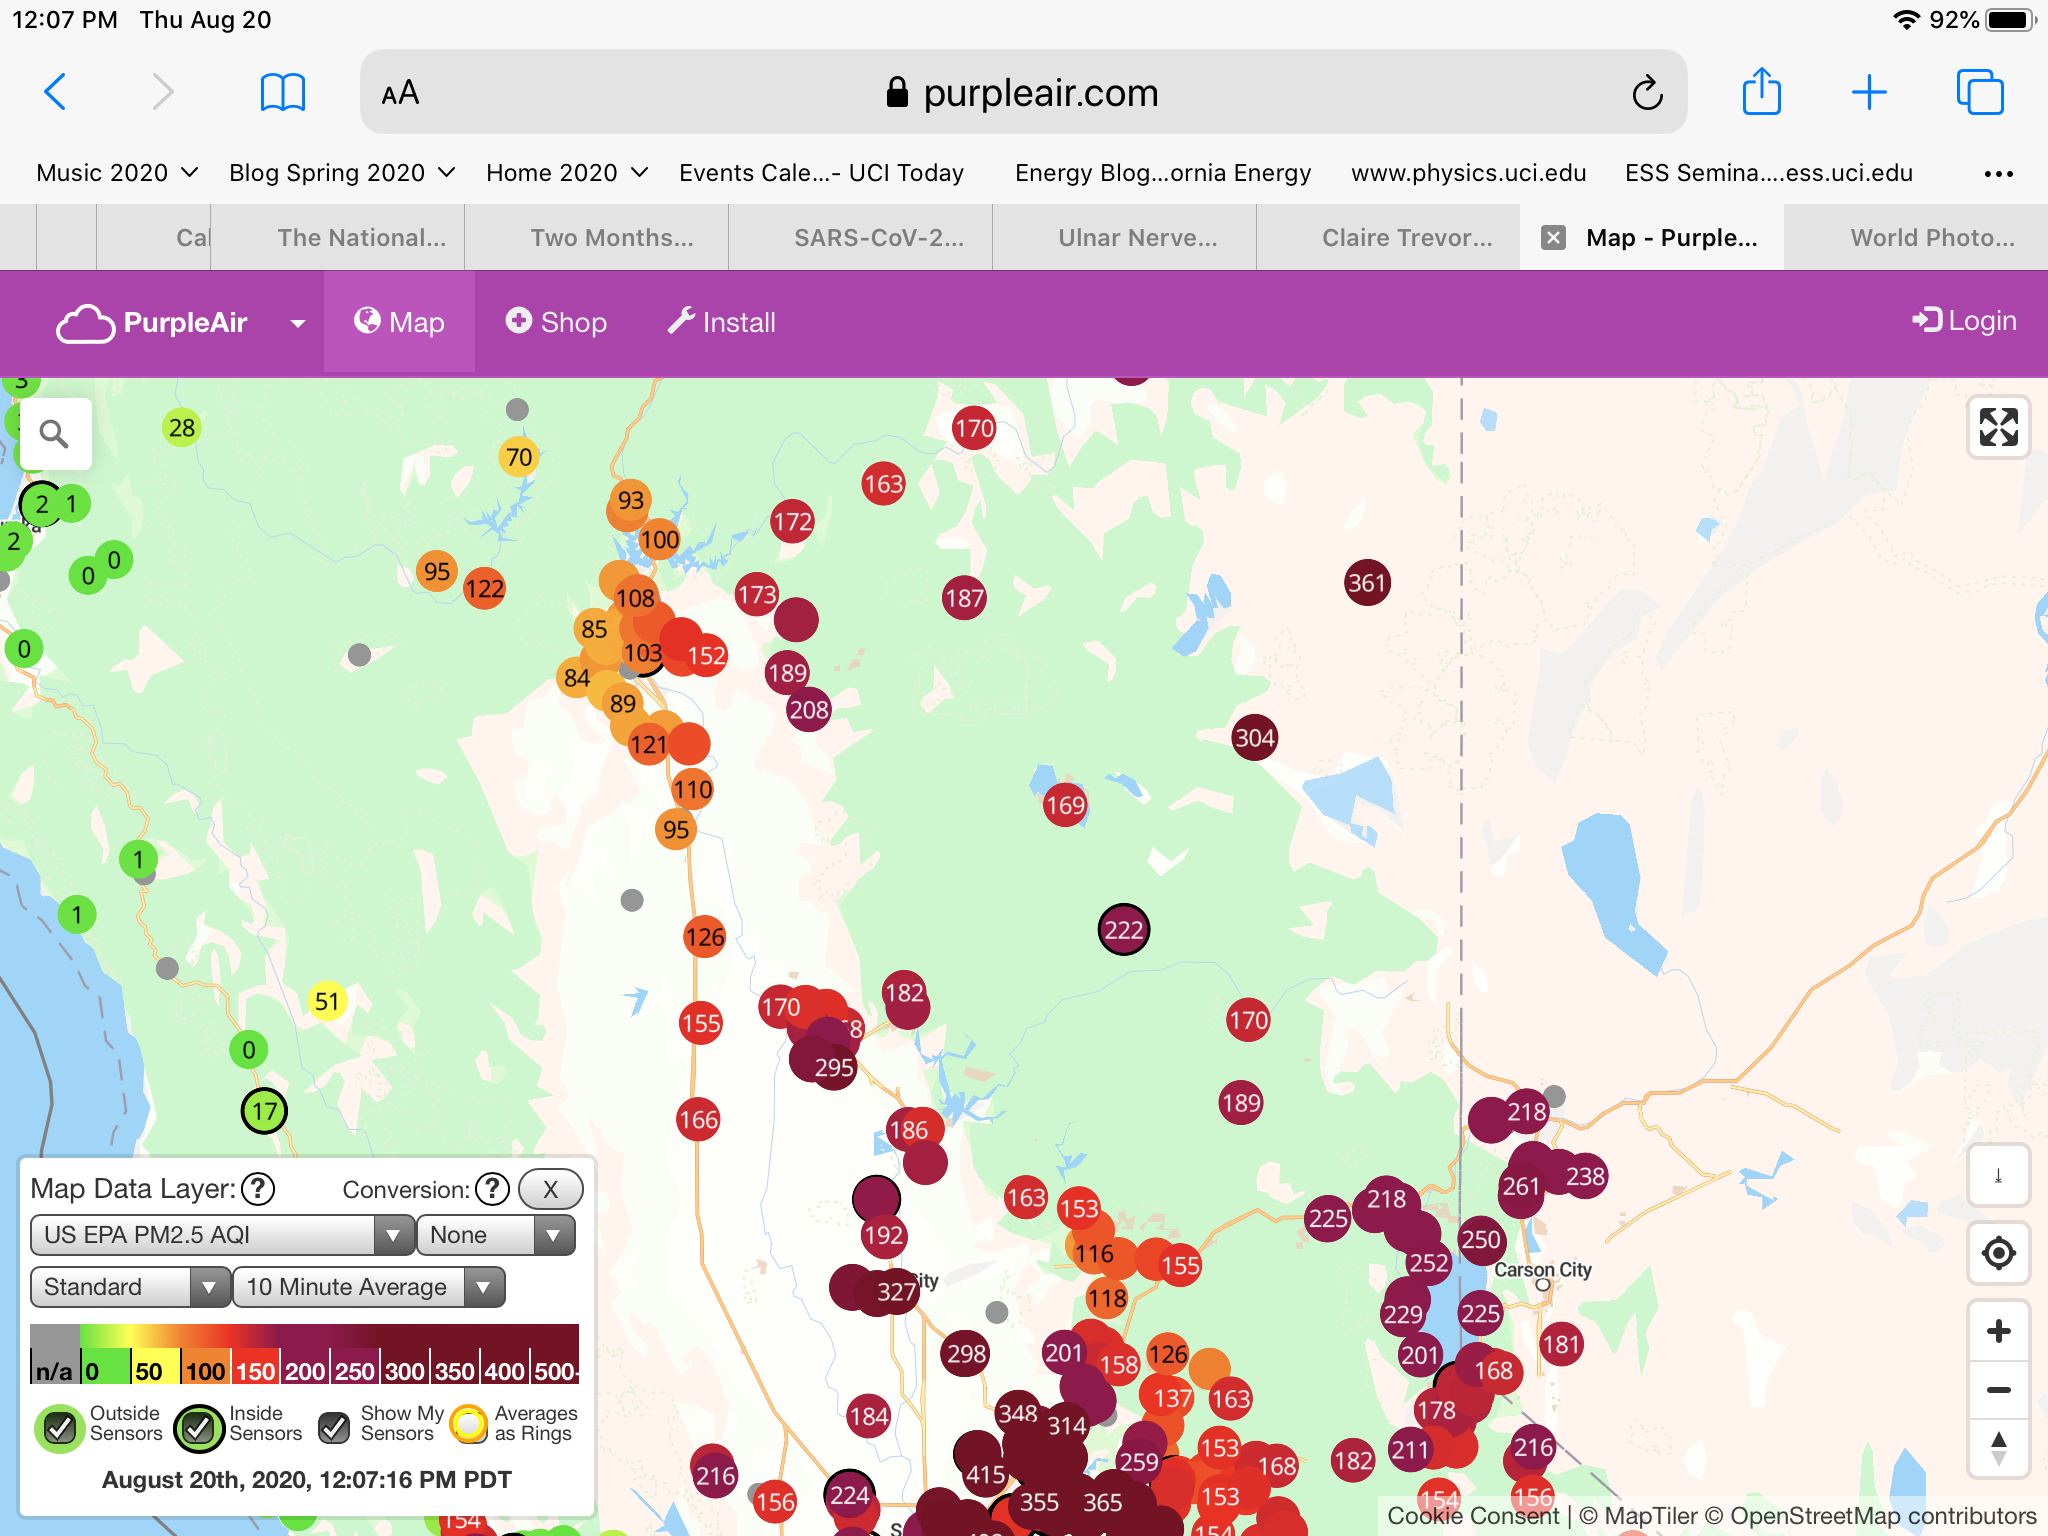
The PurpleAir detectors are for particulates of PM2.5 or 2.5 microns or 2.5 micrometers. These are small enough to get through the lungs and into the blood stream, causing health problems. This picture from PurpleAir.com starts with the code of air quality starting with green for okay, yellow for moderate, orange for unhealthy for some, and red for unhealthy for all. The darkening shades of maroon go beyond that to very unhealthy up to 300, and then Hazardous beyond that. This is only a 10 minute average for the given local time.
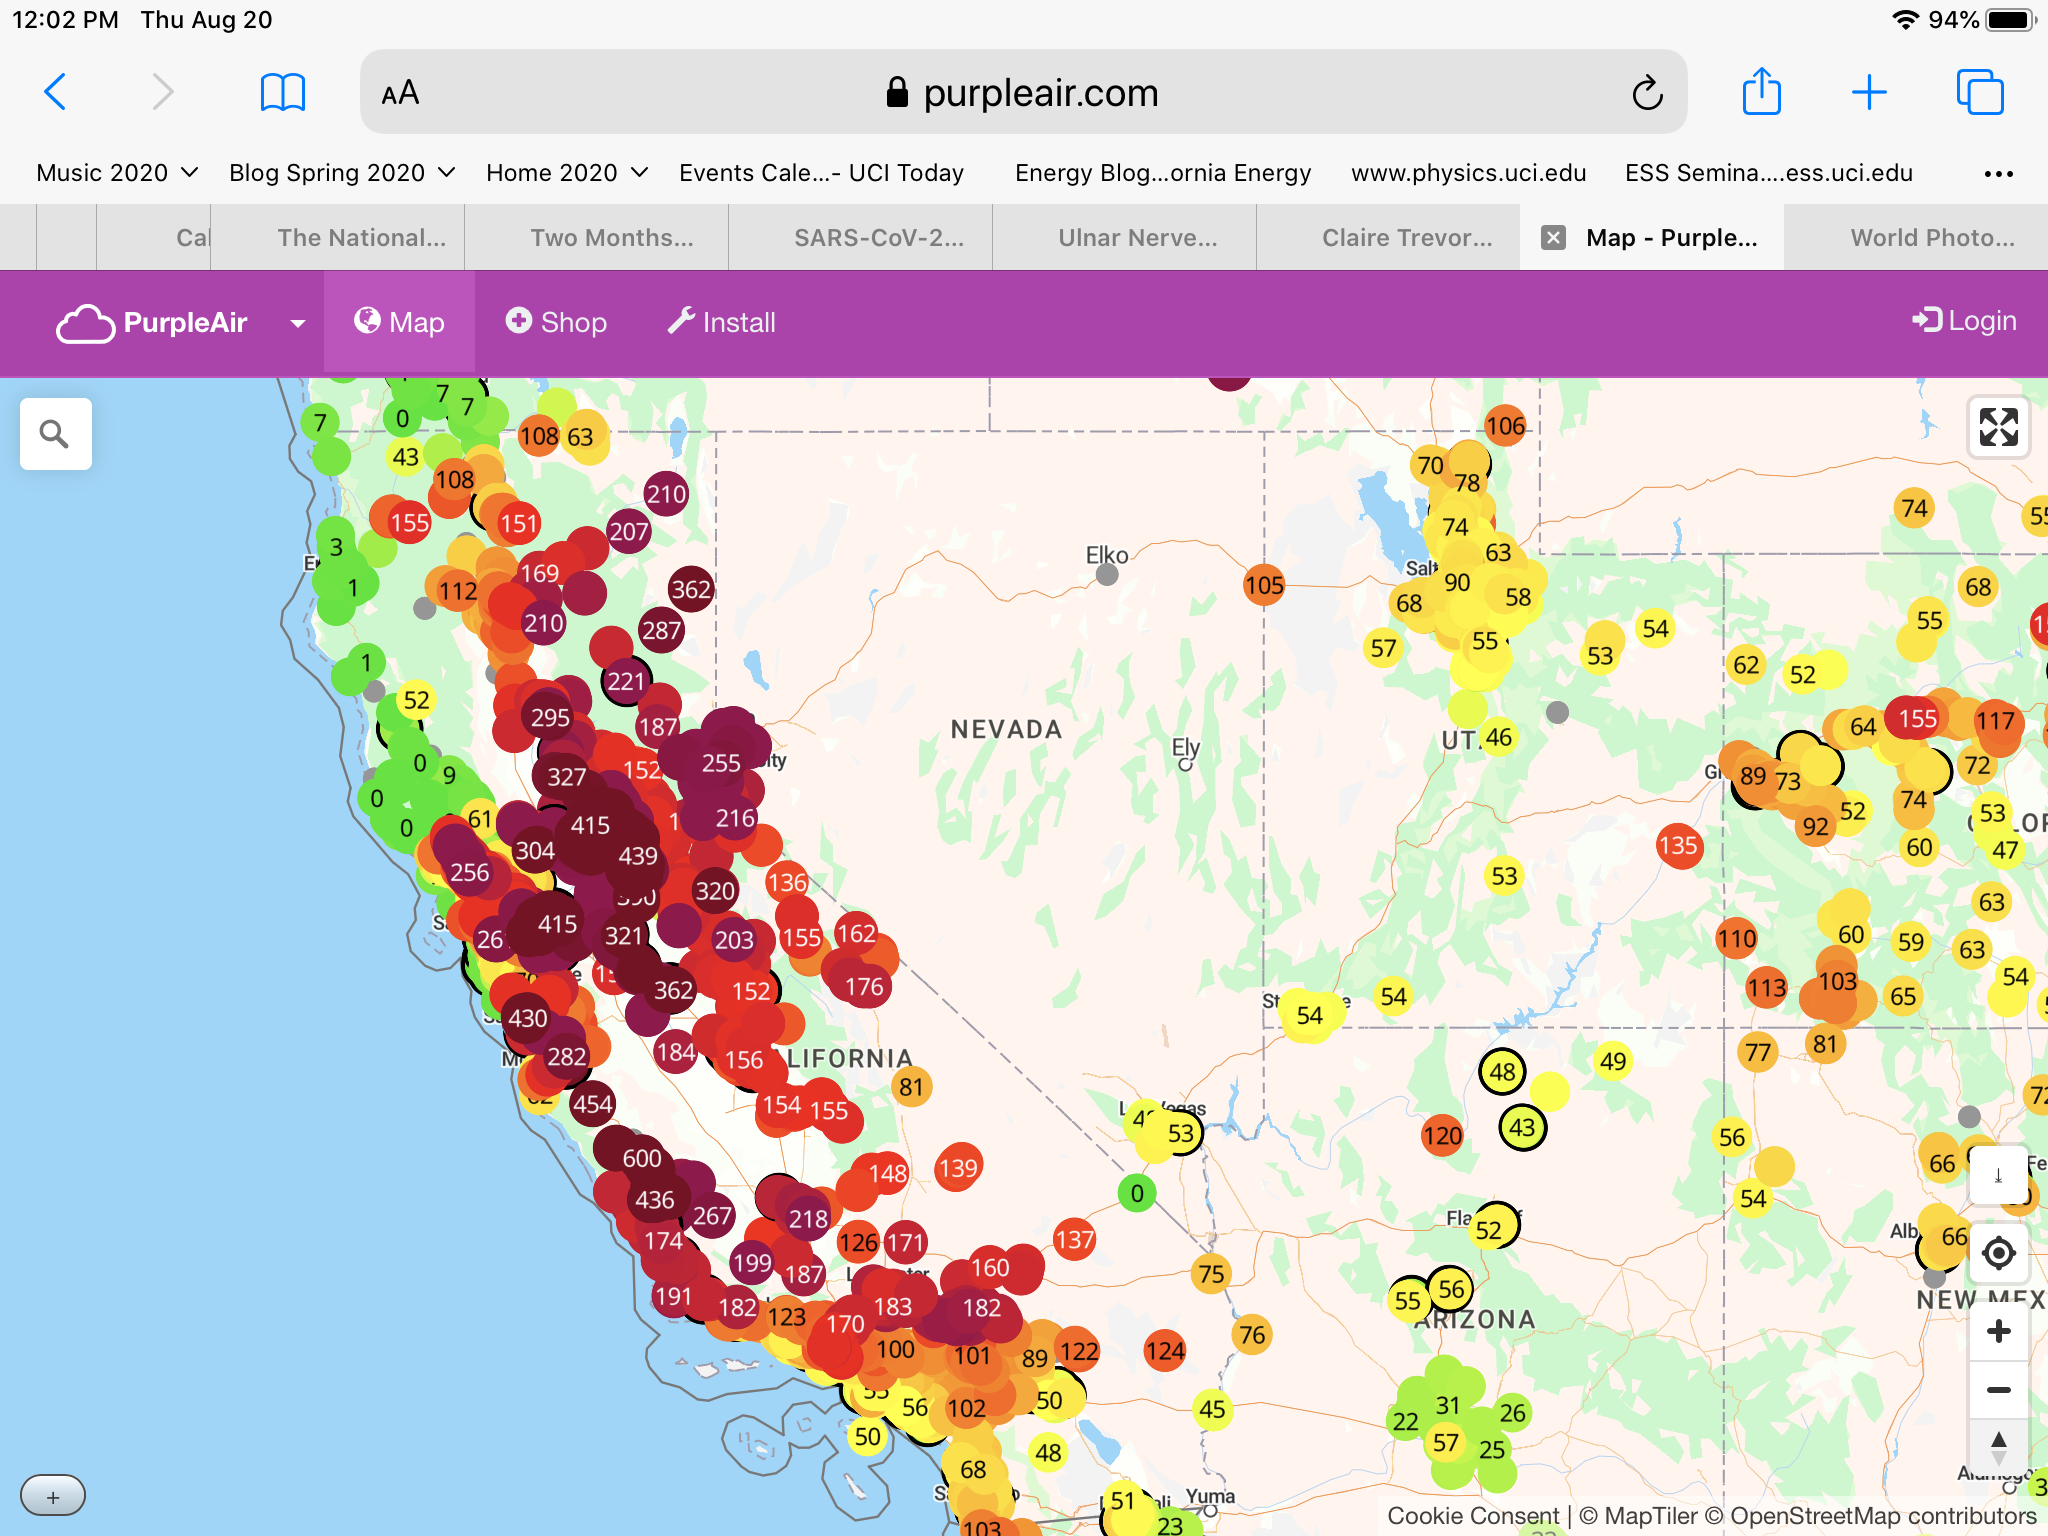
This is an overview of the hazards faced across California.
We start with Southern California and work our way up North. These are the Lancaster and Victorville areas, North of the San Gabriel mountains and Los Angeles.

This has Bakersfield to the East, and Paso Robles on the West.

Below is the CZU Lightning Complex Fire in the Santa Cruz and San Mateo area.

Below is the SCU Lightning Complex Fire of Contra Costa, Alameda, Santa Clara, and Stanislaus counties.

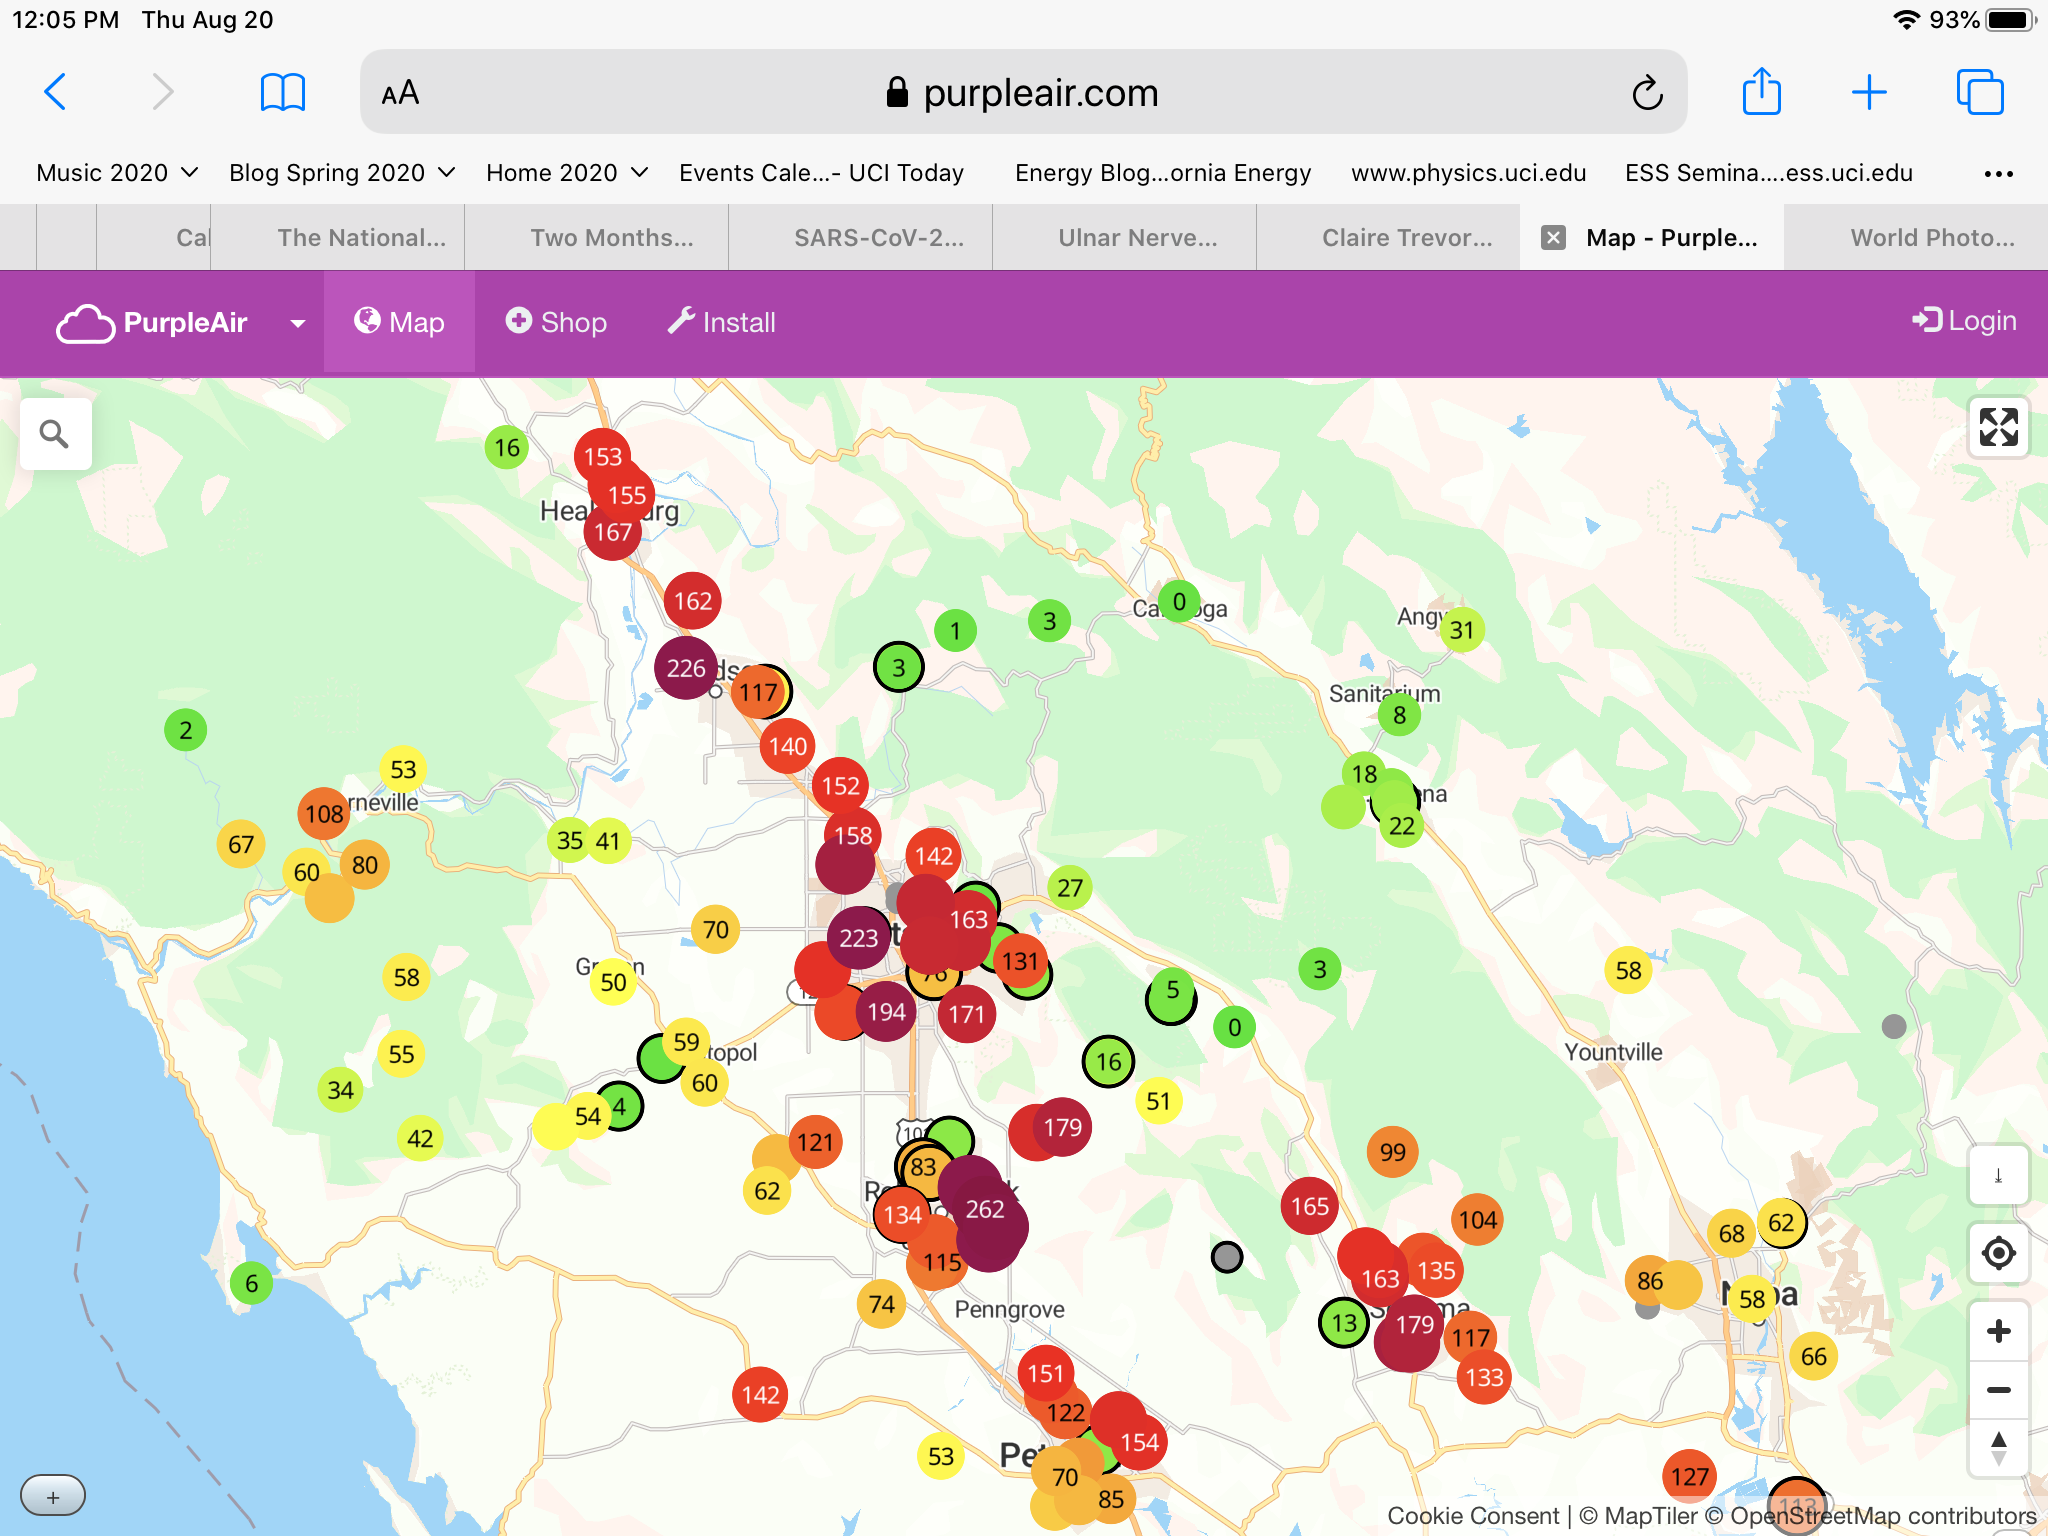
Below is the LNU Lightning Complex Fire of Napa County, which surrounds Lake Berryessa to the East.
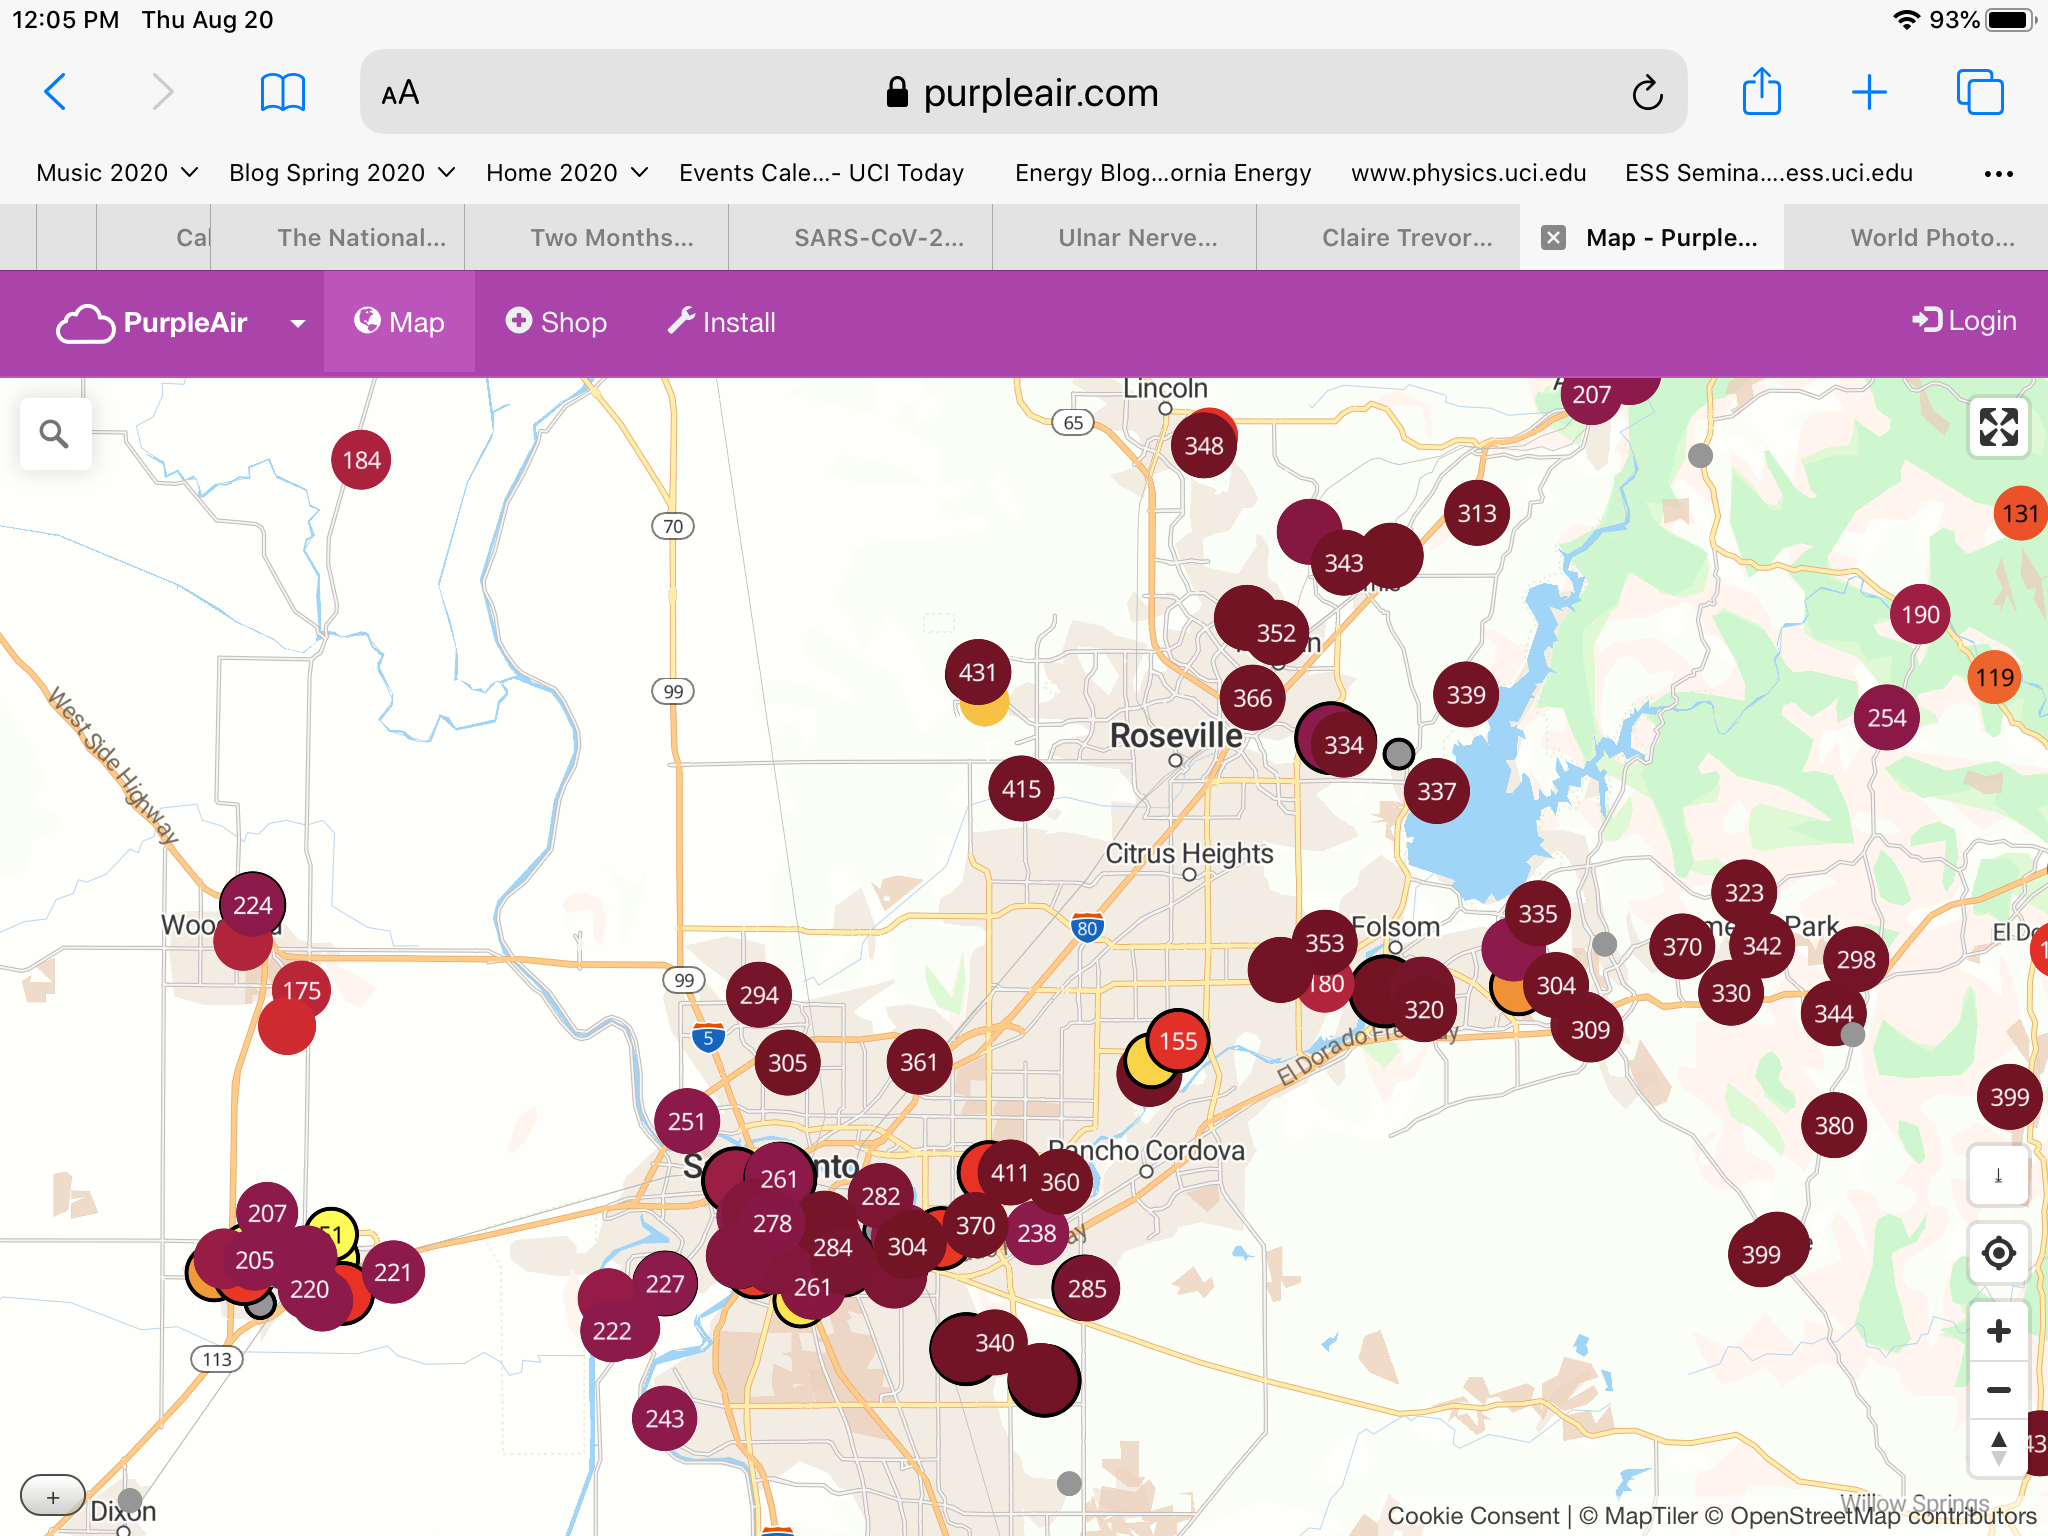
Below are fires around Sacramento on the West, and Lake Tahoe on the East.
Western US Drought Map
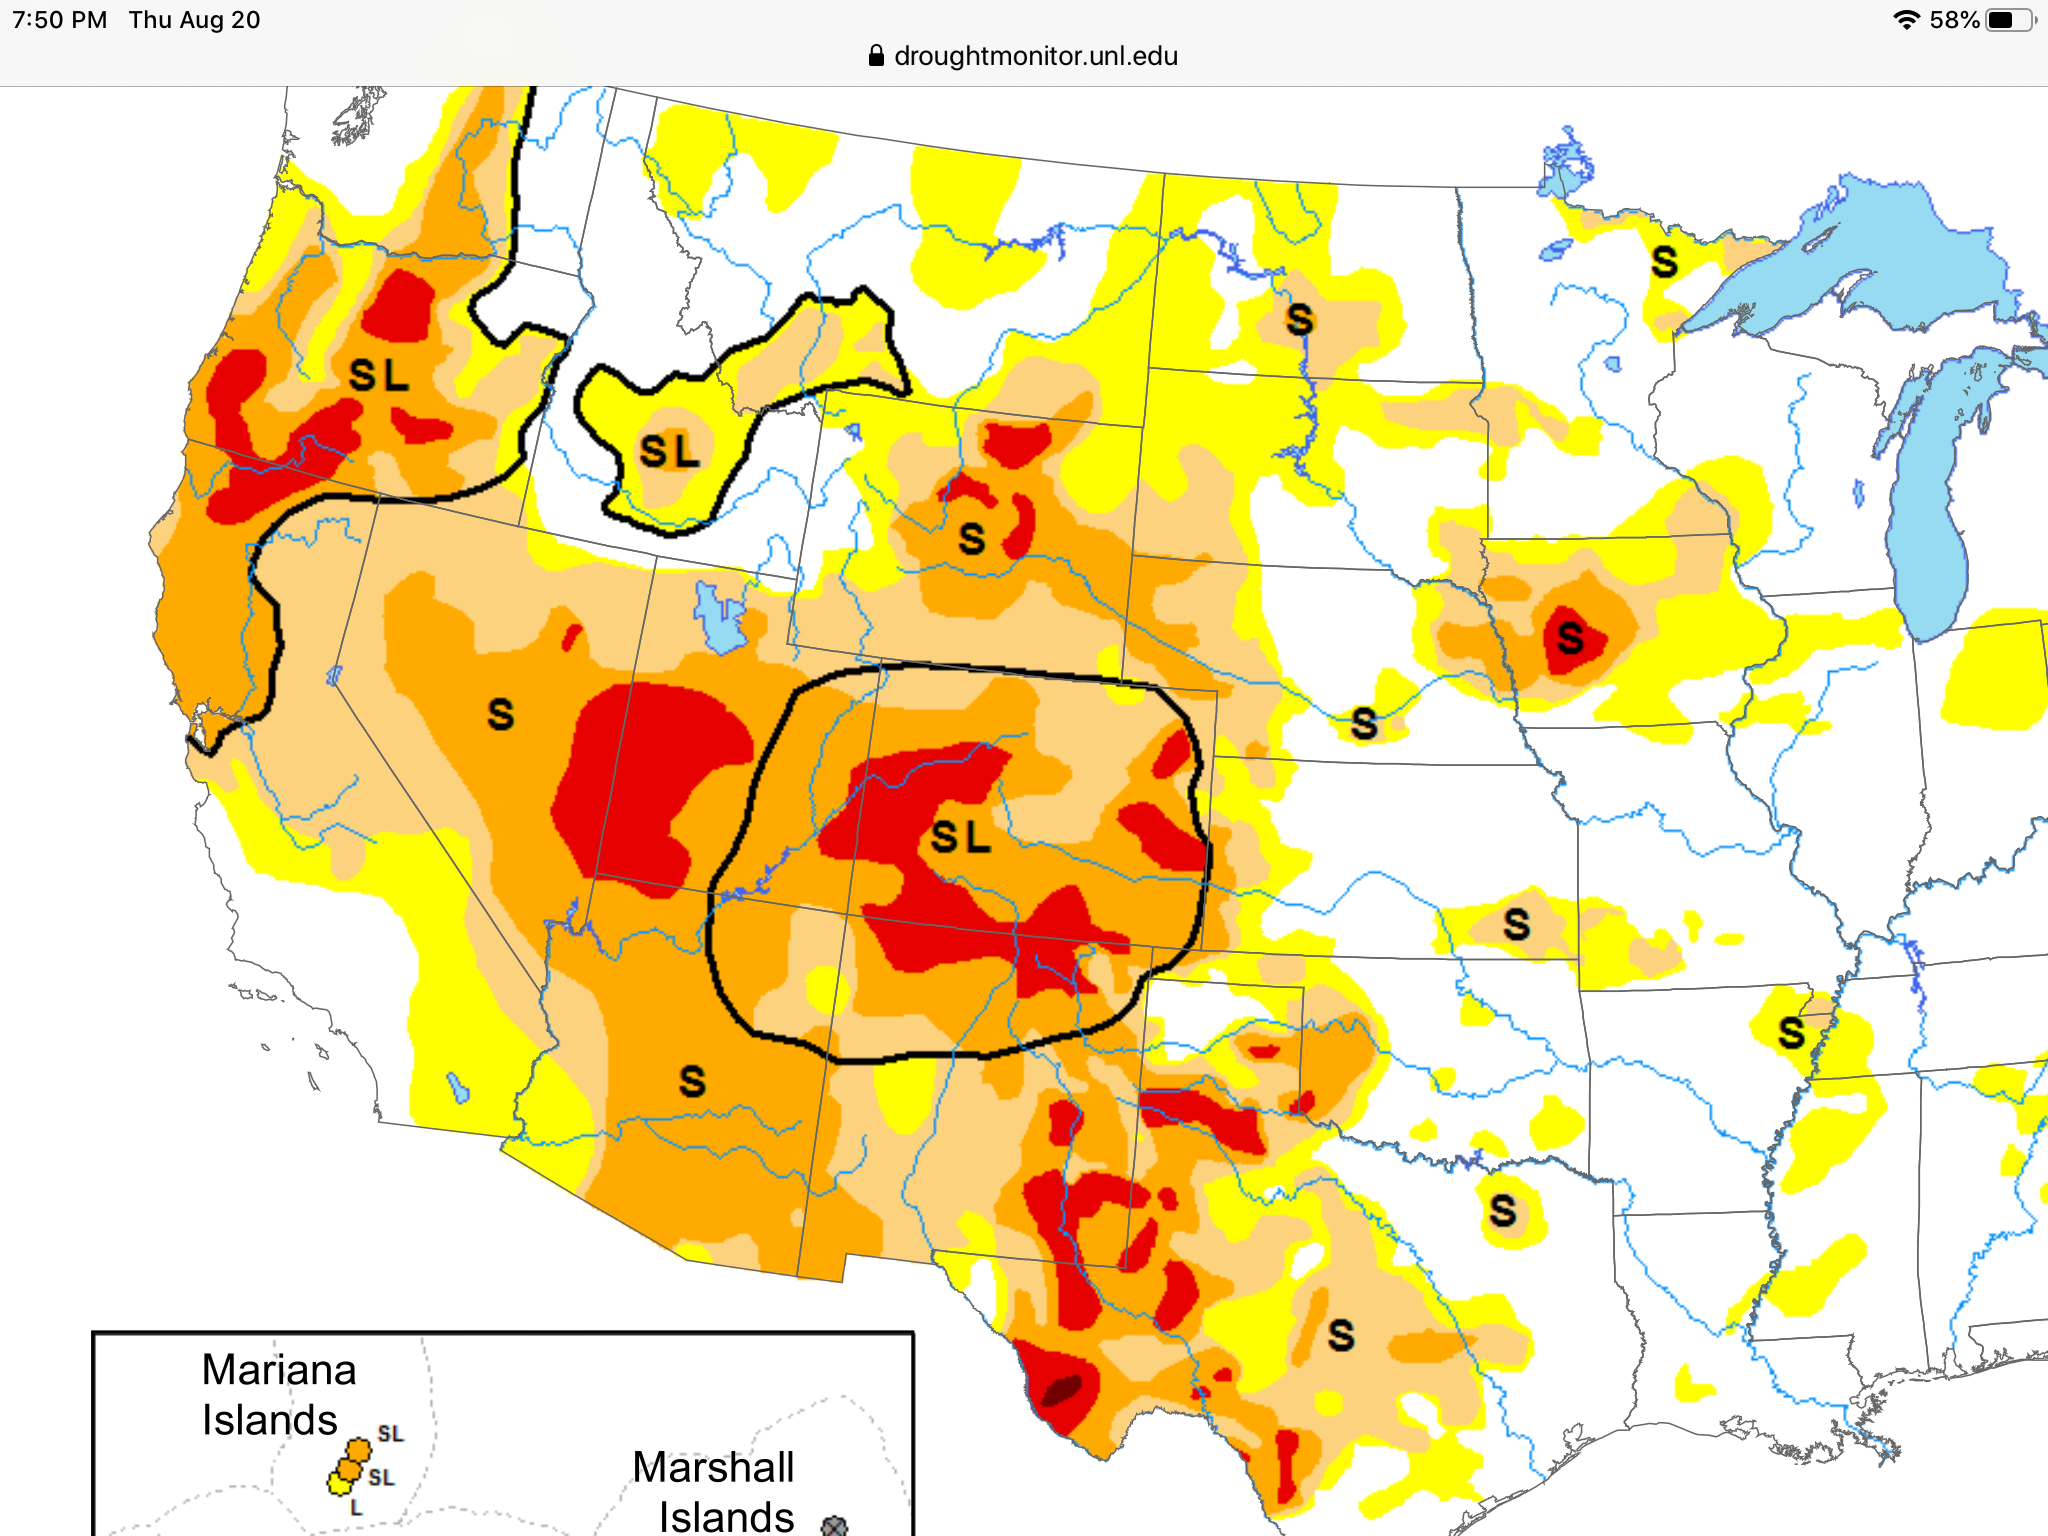
The yellow areas are abnormally dry. The light tan is moderate drought. The orange is severe drought, and the red is extreme drought. The Northern part of California is largely moderate and severe drought.