
A study of Covid death data from when vaccines became available in the US until April 30, 2022, has figured out how many lives could have been saved by those people being vaccinated up until 100%, at the rate that vaccinations originally started at. The US would have prevented 318,000 deaths in this period, which is one-half of the deaths in this period! The study was carried out by the Brown School of Public Health at globalepidemics.org.
Here, we present their numbers for the US (population 330 million), and the four leading states in population: California (39.3 m); Texas (28.6 m); Florida (21.2 m); and New York (19.5 m). Together, their population makes up about a third of the US population.
We jump to present the conclusion of the percentage of Covid deaths in this period that would have been preventable with a full vaccination program: US (49.7%); California (34.0%); Texas (49.8%); Florida (56.1%); and New York (37.5%).
Commentators point to the Democratic governance of California and New York leading to the lower numbers, and to the Republican governance of Texas and Florida. We know that it was not just the inhibition of vaccination requirements in Texas and Florida, but in closures, masking and social distancing requirements. The continuing surveys by the Kaiser Family Foundation (KFF) also show the strong influence of political alignment and polarized media sources.
The National Public Radio, in an article on December 5, 2021 by Daniel Wood and Geoff Brumfiel has presented a county by county analysis also showing a political alignment of Covid deaths. At the end of this article, we will present that data just for my neighboring: Orange County, CA; Los Angeles County, CA; and San Diego, CA.
The Table of the Brown School data are Covid deaths from the start of 2021 until April 30, 2022. The death rates per one million are for the 18 and older population. The columns are the State, Deaths since the 2021 start, Deaths per 1 million, Vaccine Preventable deaths, Preventable Deaths per 1 million, and the Percentage of Deaths which were Preventable.
| State | Deaths | Per Million | Preventable | Per Million | Percent |
| US | 641,305 | 2,487 | 318,981 | 1,237 | 49.7% |
| CA | 63,877 | 2,086 | 21,750 | 710 | 34.0% |
| Texas | 59,795 | 2,767 | 29,773 | 1,378 | 49.8% |
| Florida | 52,059 | 3,021 | 29,200 | 1,694 | 56.1% |
| NY | 29,830 | 1,935 | 11,195 | 726 | 37.5% |
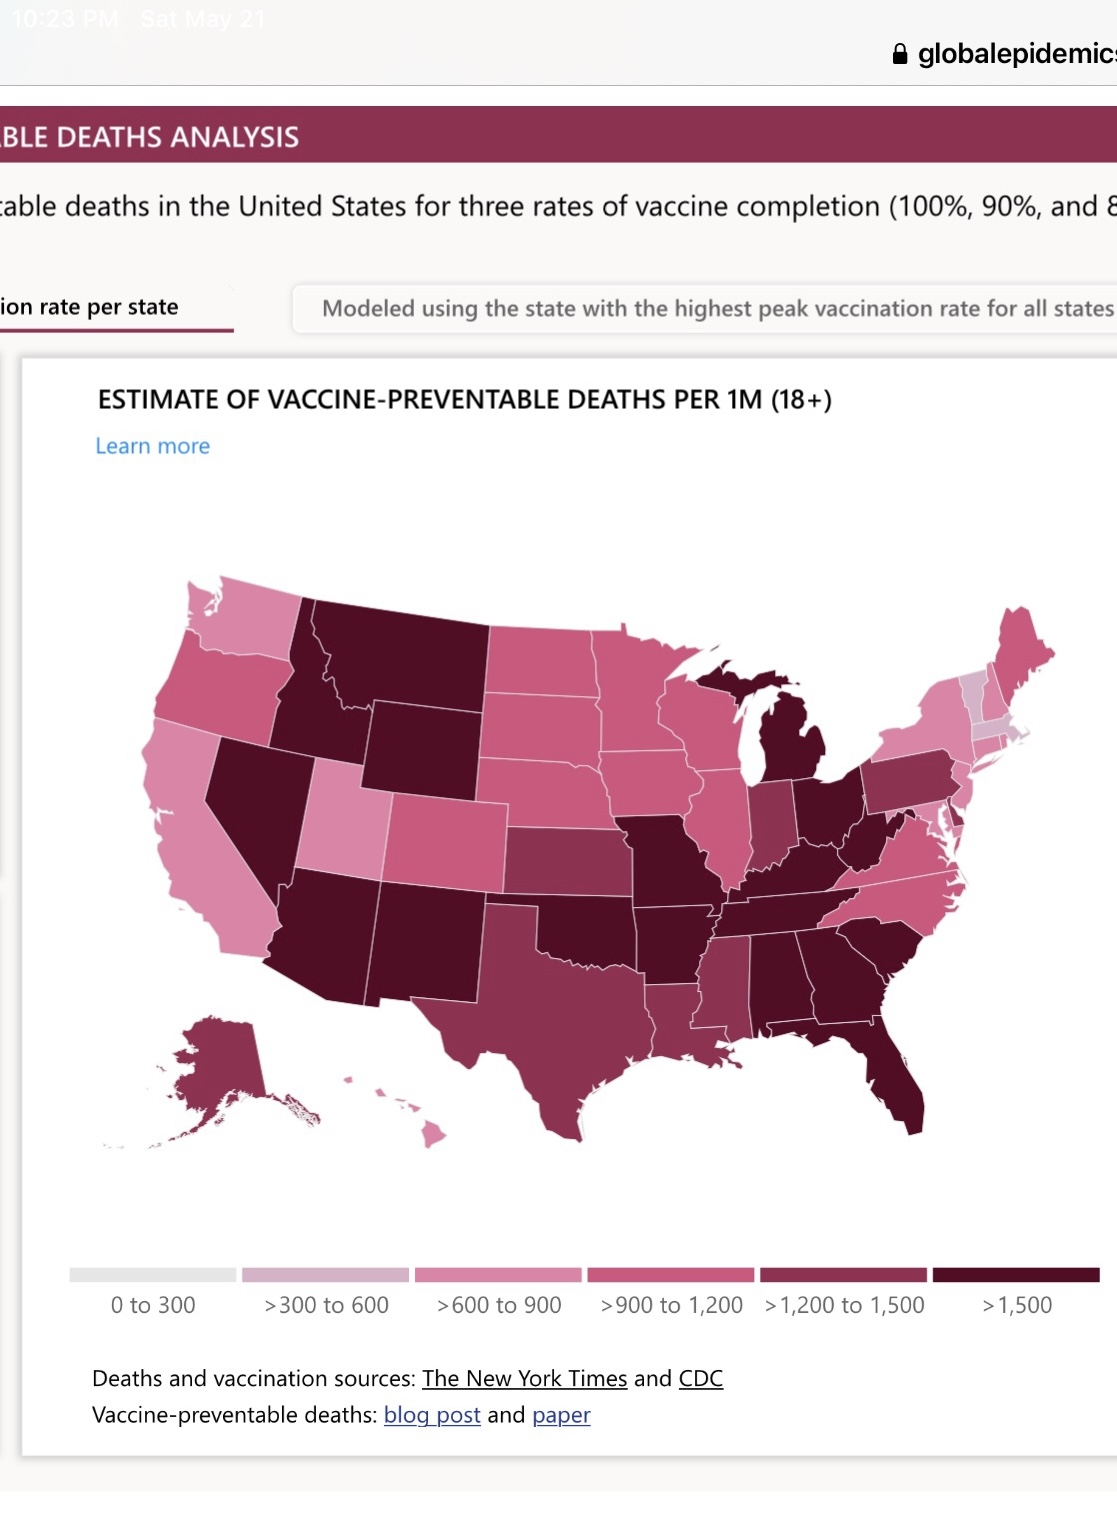
For completeness, we include here their US map of Deaths per Million.
The NPR analysis by counties runs from May 1, 2021, to December, 2021. It compares: the vaccination rate of the county for those of age 18 and above to the average of 67%; the deaths per 100,000 to the average of 61 deaths per 100k; and the percent who voted for Republican Donald Trump in 2020. Here are the ones for Southern California.
| CA County | Percent Vacc. | Deaths per 100k | % for Trump |
| Orange | 78% | 24 | 44% |
| San Diego | 63% | 19 | 37% |
| Los Angeles | 75% | 32 | 27% |
While we have ordered the counties by the reliably counted percent for Trump, they do not correlate with the Deaths per 100k, nor even anti-correlate with the percent vaccinated. Since the deaths are mainly in the senior population, we note that in general, the vaccination rates for seniors are usually strong irrespective of the political entity. Recorded deaths can also vary with the methods adopted by different counties.