We start with emission data from the UN Environment Report, and show the areas in which emissions can be sharply cut with existing technologies. The current Paris Accord agreements are just keeping up with business as usual, given rising economic growth and population growth.
New goals are expected soon. The global mean surface temperature has already risen 1º C or 1.8º F above pre-industrial times. The new goals would have to be three times the present cuts in order to hold global warming to 2º C, or 3.6º F above pre-industrial levels. They would have to be increased to five times the present to hold the temperature to 1.5º C or 2.7ºF above pre-industrial levels. The current commitments will cause around 3.2ºC warming, which is 5.8ºF.
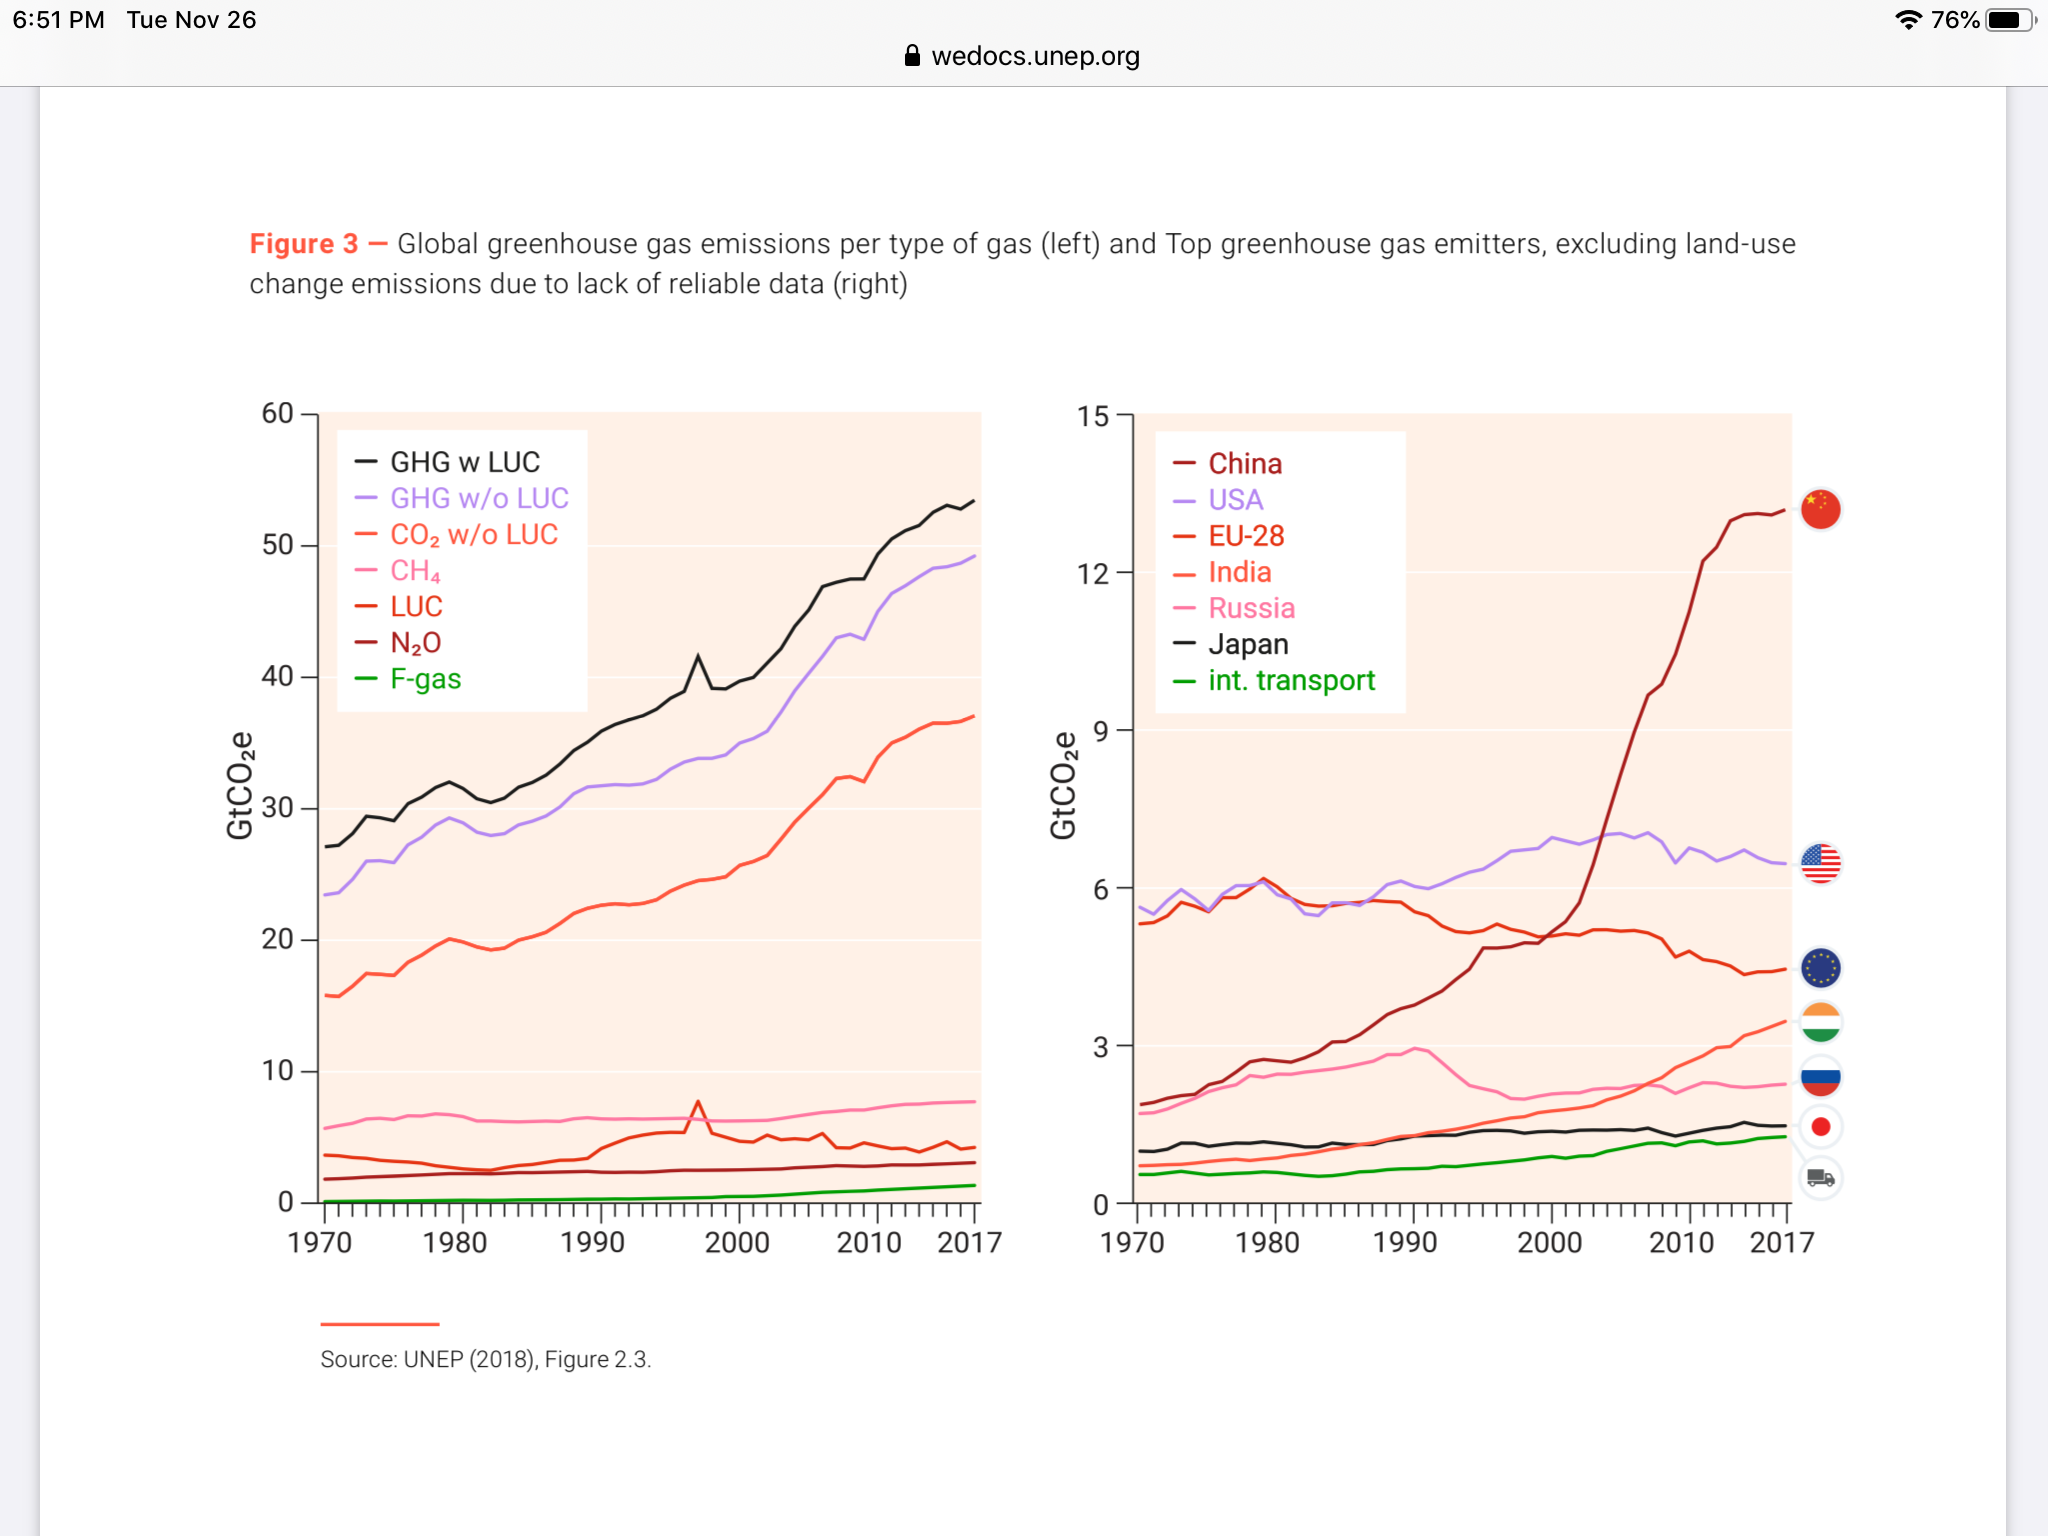
Below, on the left, are the history of emissions of the top six greenhouse gas emitters. Also shown at the bottom are emissions due to international air travel and shipping. In about 2005, China surpassed the US. The UN units of emissions are in Gigatons or Billions of metric tons of CO2 or equivalent emissions, abbreviated as GtCO2e.
Current 2018 emissions are 55.3 GtCO2e. To hold the temperature rise to 2ºC or 3.6ºF, emissions must fall by 15 Gigatons by 2030, or a 2.7% yearly decrease. To reach only a 1.5ºC temperature rise, a 7.6% annual decrease is required, and a reduction of 32 Gigatons by 2030.
California reached its goal of reducing emissions to 1990 levels in 2016. SB32 now has the goal of reducing emissions to 40% below 1990 levels by 2030.
The 2019 United Nations Climate Change Conference (COP 25) will take place in Madrid from Dec. 2-13. This will focus on the oceans, and nations adding the ocean to their climate plans. See the Ocean Conservancy here.
On the right are the emissions per capita, in metric tons of CO2 equivalent (tCO2e), with the US at about 20, and China about 10. Russia is second at about 17, and Japan slightly exceeds China at about 11. A metric ton is equal to 1.1 US tons, so per capita, we have emissions of about 22 US tons per year of CO2e or equivalent greenhouse gases. Global per capita emissions are about 6 metric tons. While India is often thrown in with China in terms of emissions, we note that India, at about 2.5 units per capita, is only about an eight of the per capita emissions of the US. The EU is about the same as China, at about 8, which is less than half of that of the US. Both the US and EU per capita emissions have declined over the three decades shown.

The graph on the left are the contributions of the various greenhouse gases, topped by the total with or without LUC, which are land use changes. In 2017, the total was 53.5 GtCO2e. Next, in the orange, is total CO2, and in pink is methane, with LUC next, and then N2O. The graph on the right is the same as the left one, above.
It is often said that China’s assignable emissions have to be lowered, by the emissions incurred in producing products that are exported and consumed in other countries. These must be the most reliable estimates of that. On the left, China’s total emissions of about 10 are reduced to about 8.5. The US emissions of about 5 are increased when emissions elsewhere that give products consumed by us are added, to about 5.5. The EU-28 add more for consumption, from about 3.8 to 4.2. More accurate numbers will be used when I find them, but the general idea is well indicated in the graph. On the right is the per capita emissions in a territory, with exported subtracted or imported consumption added.

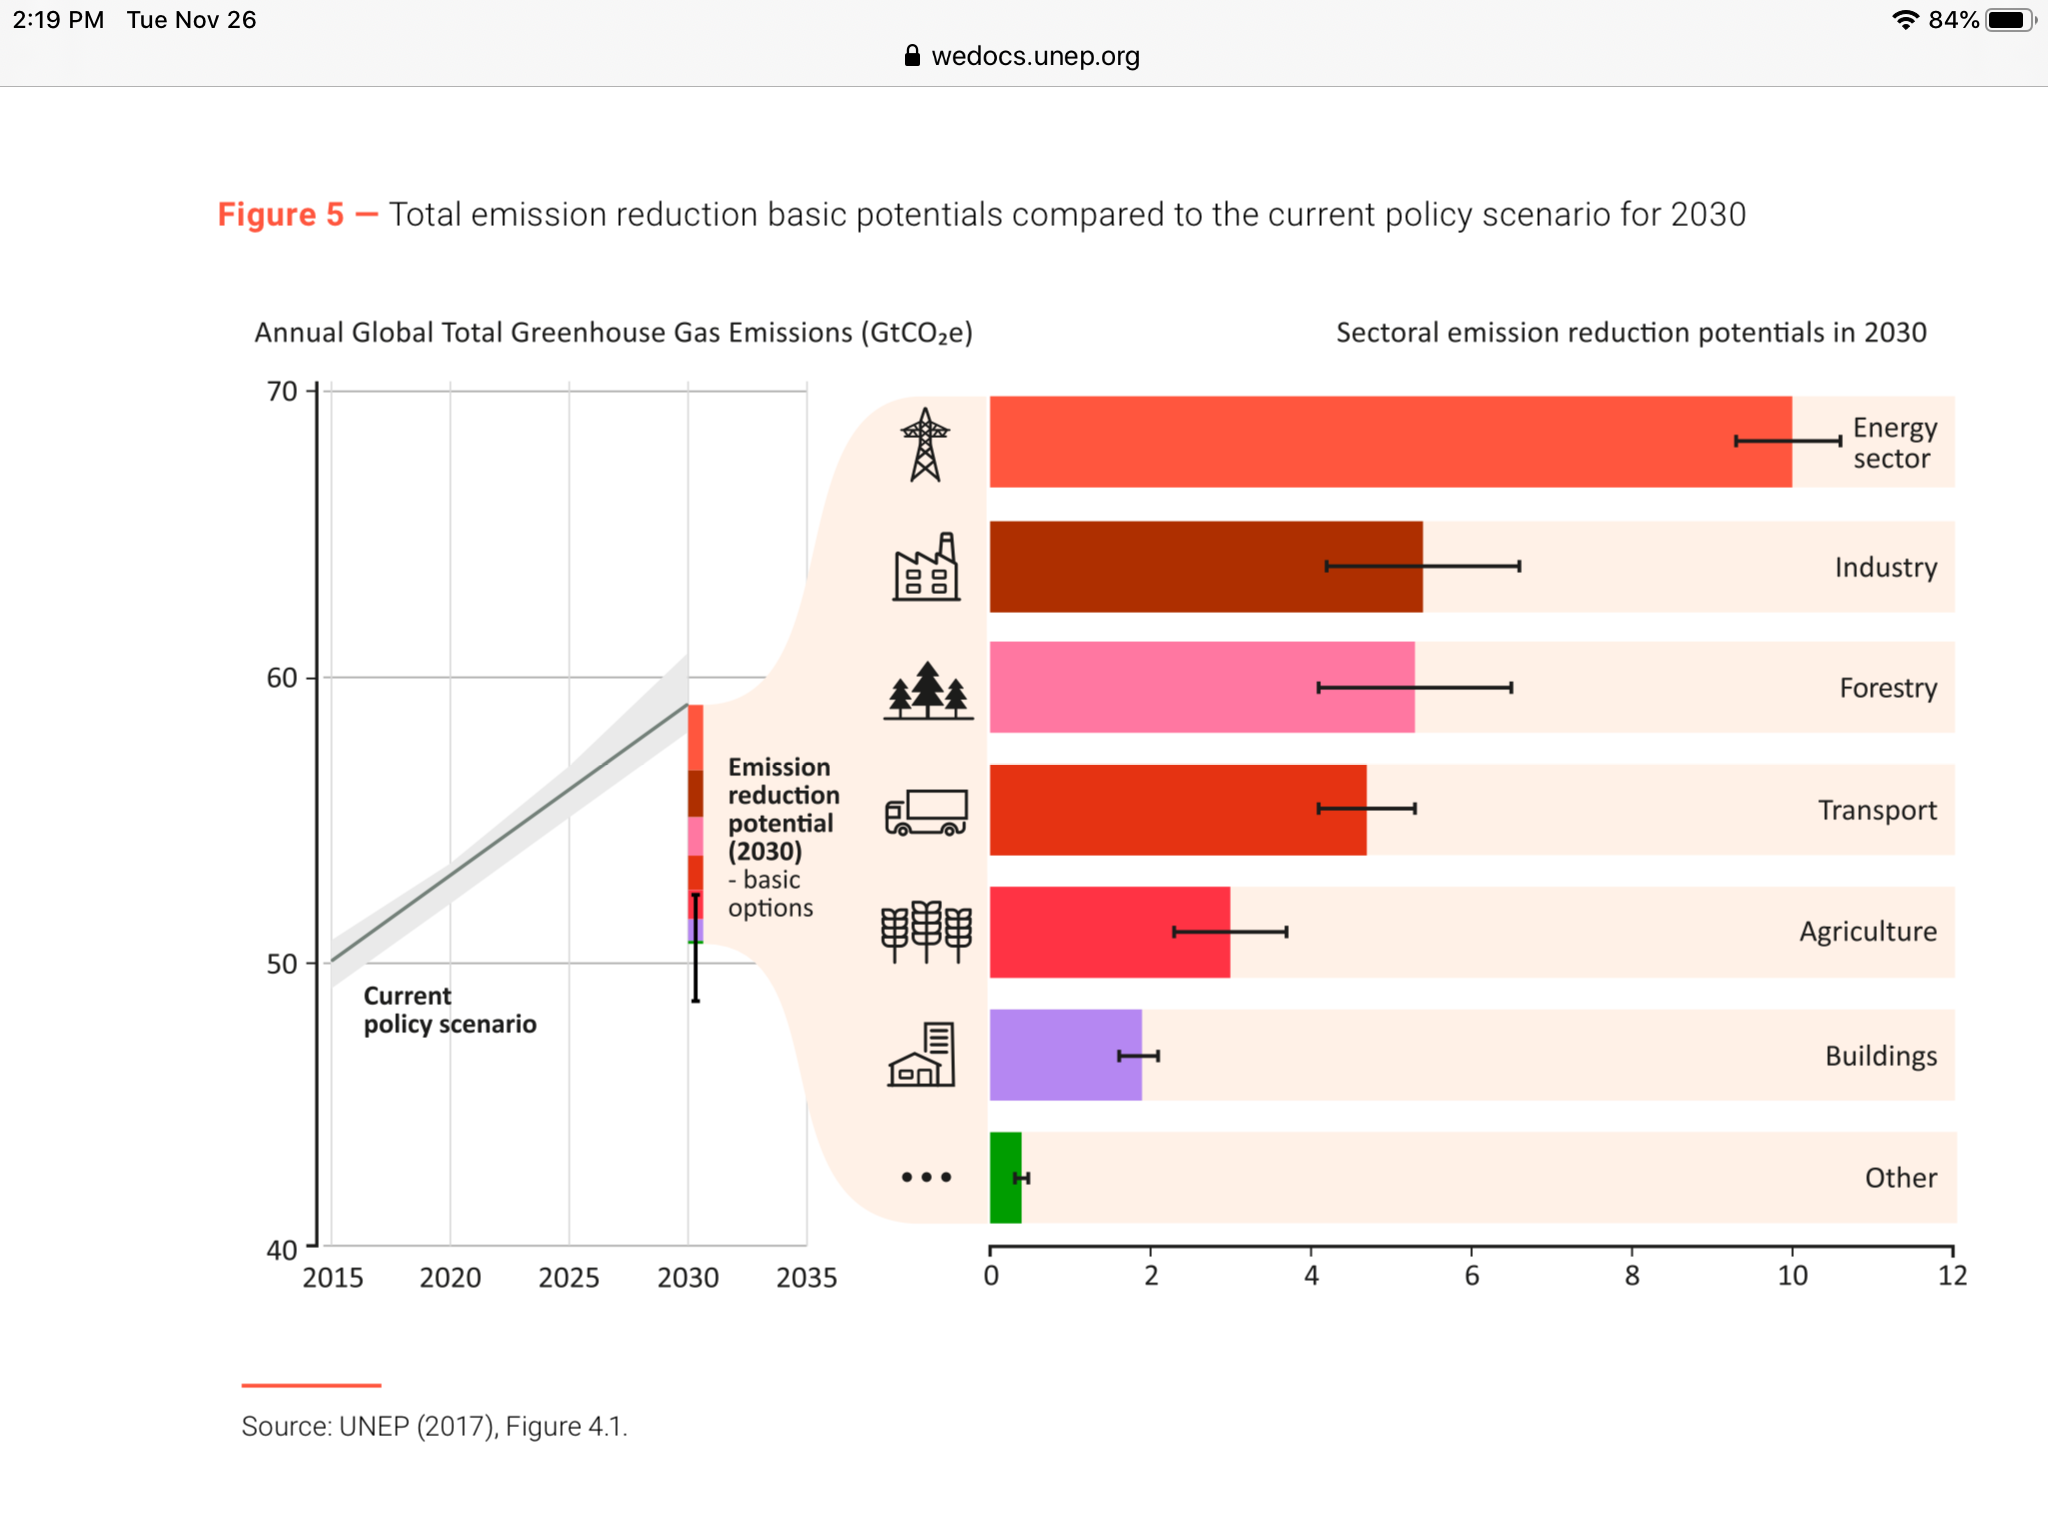
Below is a list of emission reduction potentials by category, achievable by 2030. They add up to about 30 units. They add up to about 31 units, and are shown subtracted from total emissions on the left of about 60 units in 2030. That means that the emissions in 2030 would be reduced to about 30 units. So I suggest that the graph on the left might be mislabeled, and the vertical labels should be 0, 30, 60, and 90. Or, I might be confused. While the transport sector can be reduced in emissions by switching to electric vehicles, the electrical power needed would have to be supplied by clean energy.