May 1. Coronavirus Risks by State for Seniors and the Vulnerable

May 1.  Coronavirus Risks by State for Seniors and the Vulnerable 

The Henry J. Kaiser Family Foundation (kff.org) has analyzed health risks for severe Coronavirus cases by State, based on 34 criteria.  This is especially important now that 31 states are relaxing some restrictions this week, or even today.  We will present a few of these results.

At risks are adults over 65, and other adults with chronic conditions such as obesity, heart disease, high blood pressure, diabetes, cancer, and COPD.

Nationwide, 92.6 million are at risk.  This is 37.6% of adults 18 and over.  For those 65 or over, there are 51.1 million, or 14.9% of the US populations, and they are 55.2% of the 92.6 million at risk.  Those 18-65 with vulnerabilities are 41.4 million, and they are 45% of those at risk.

Nationwide, 5.1 million are underinsured.

On top of that, CNN is reporting a study that the Coronavirus will be with us another 1 and 1/2 to 2 years, and 60%-70% will be exposed.  There will be a second big wave in the fall and winter.

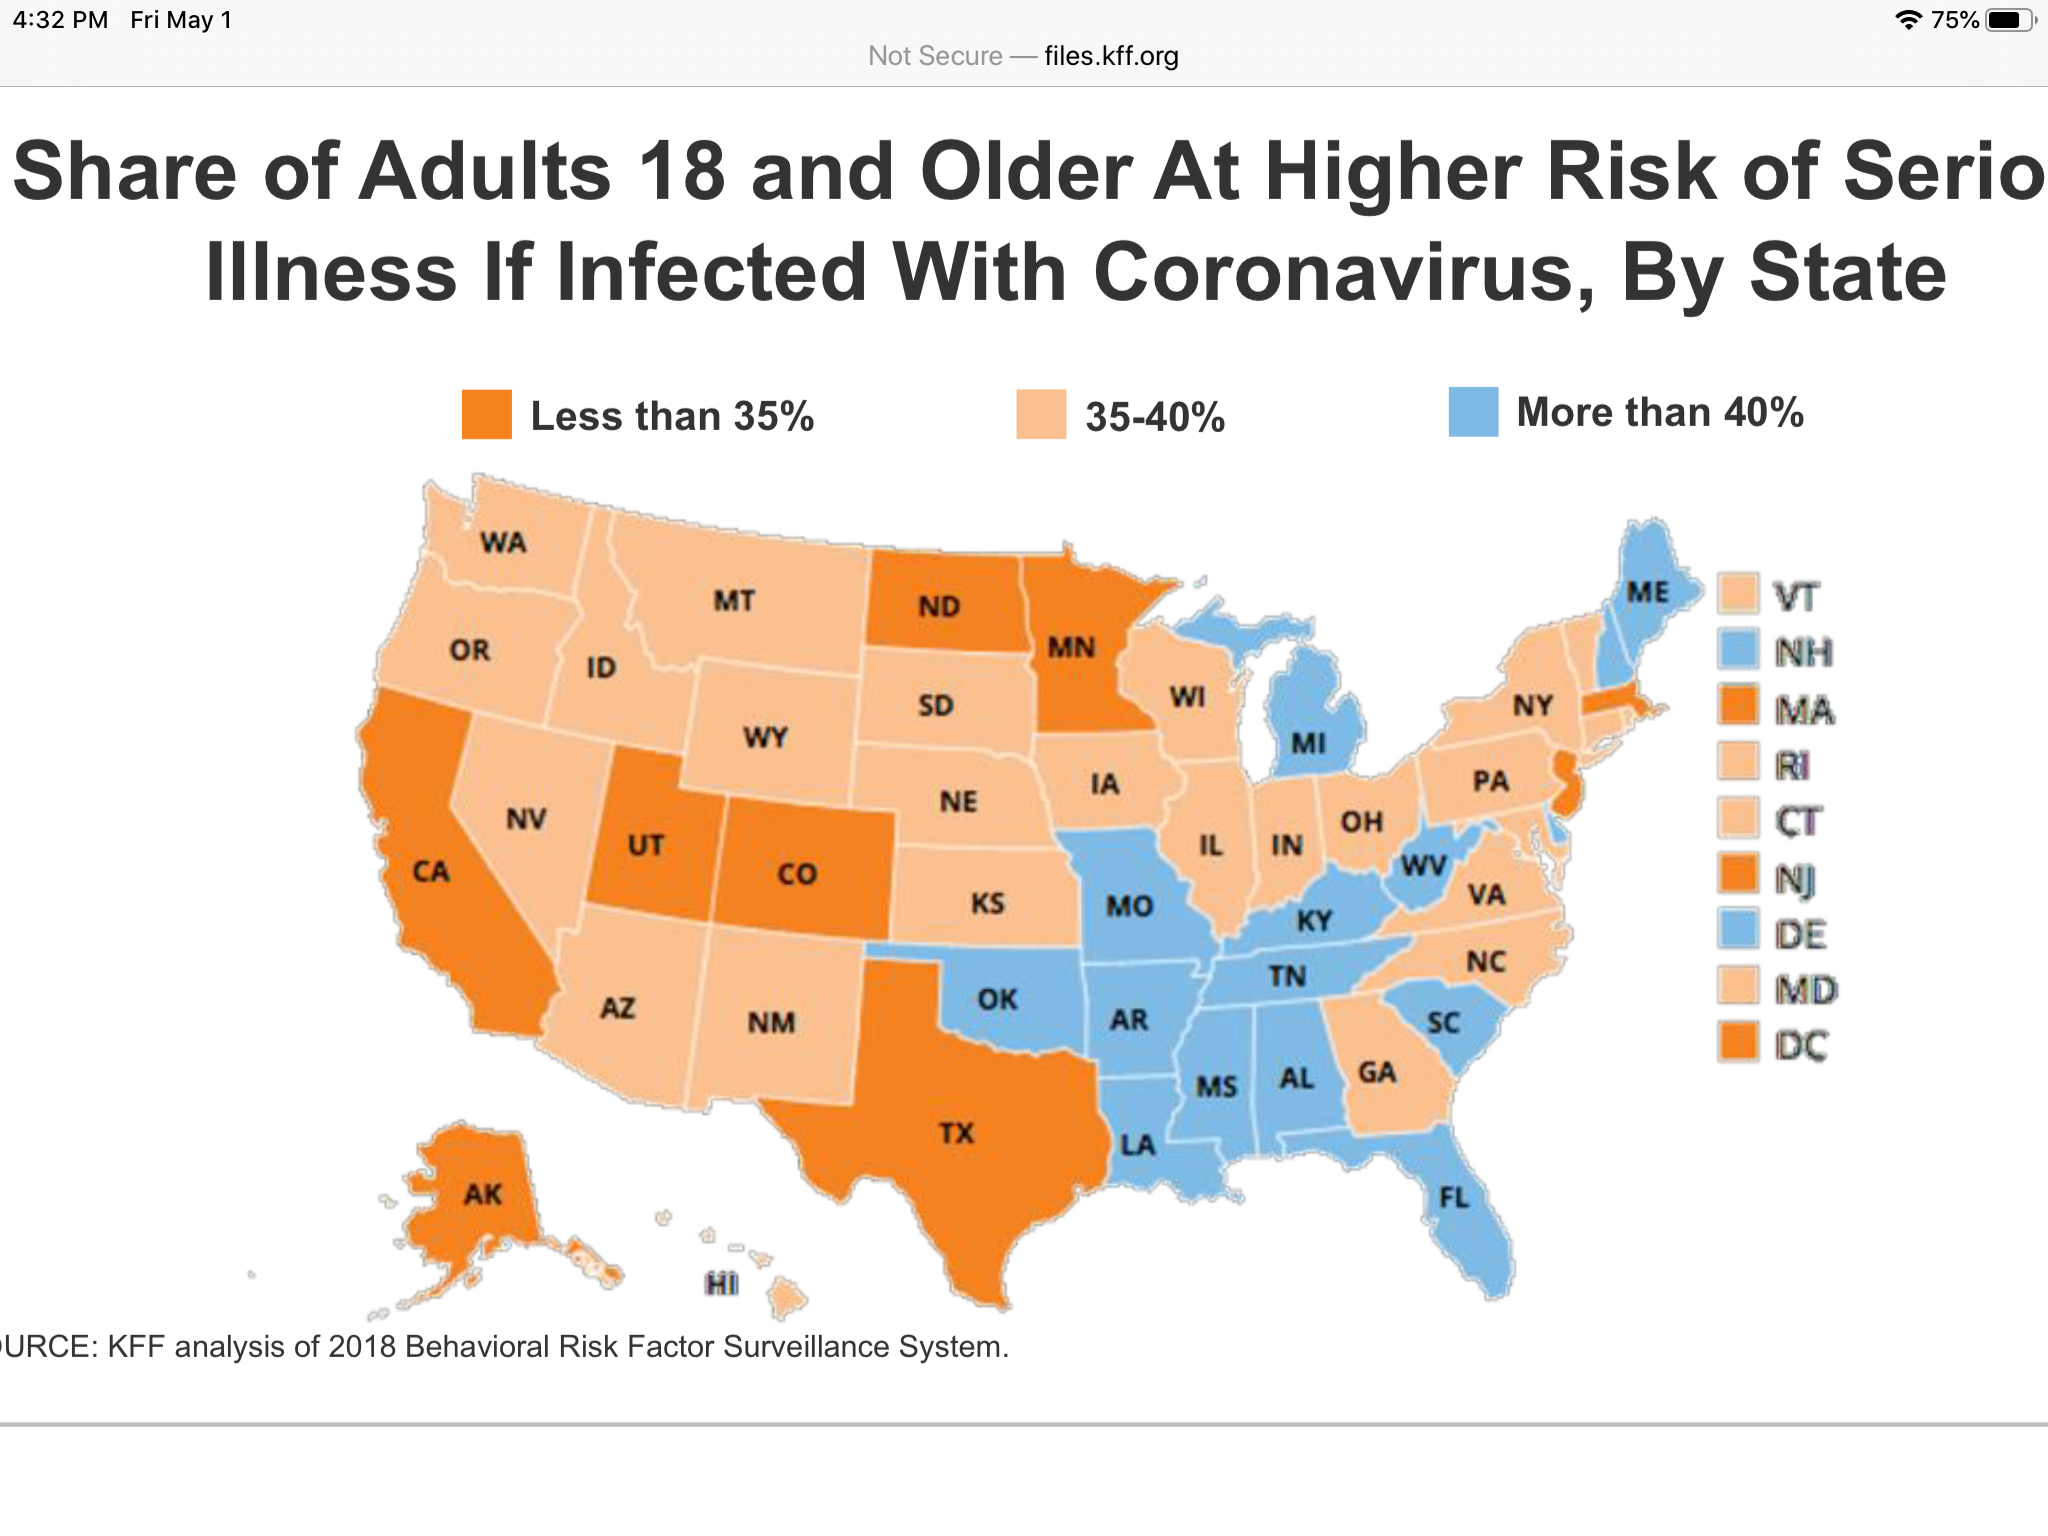
Here is the KFF map of states by ranges of the Share of Adults 18 and Older at Higher Risk of Serious Illness.  The more than 40% at risk states are in the South, plus Michigan, New Hampshire, and Maine.  Most of the Southern states are opening up now, but Michigan is holding firm.  The exceptional highest at-risk state is West Virginia at 49.3%.

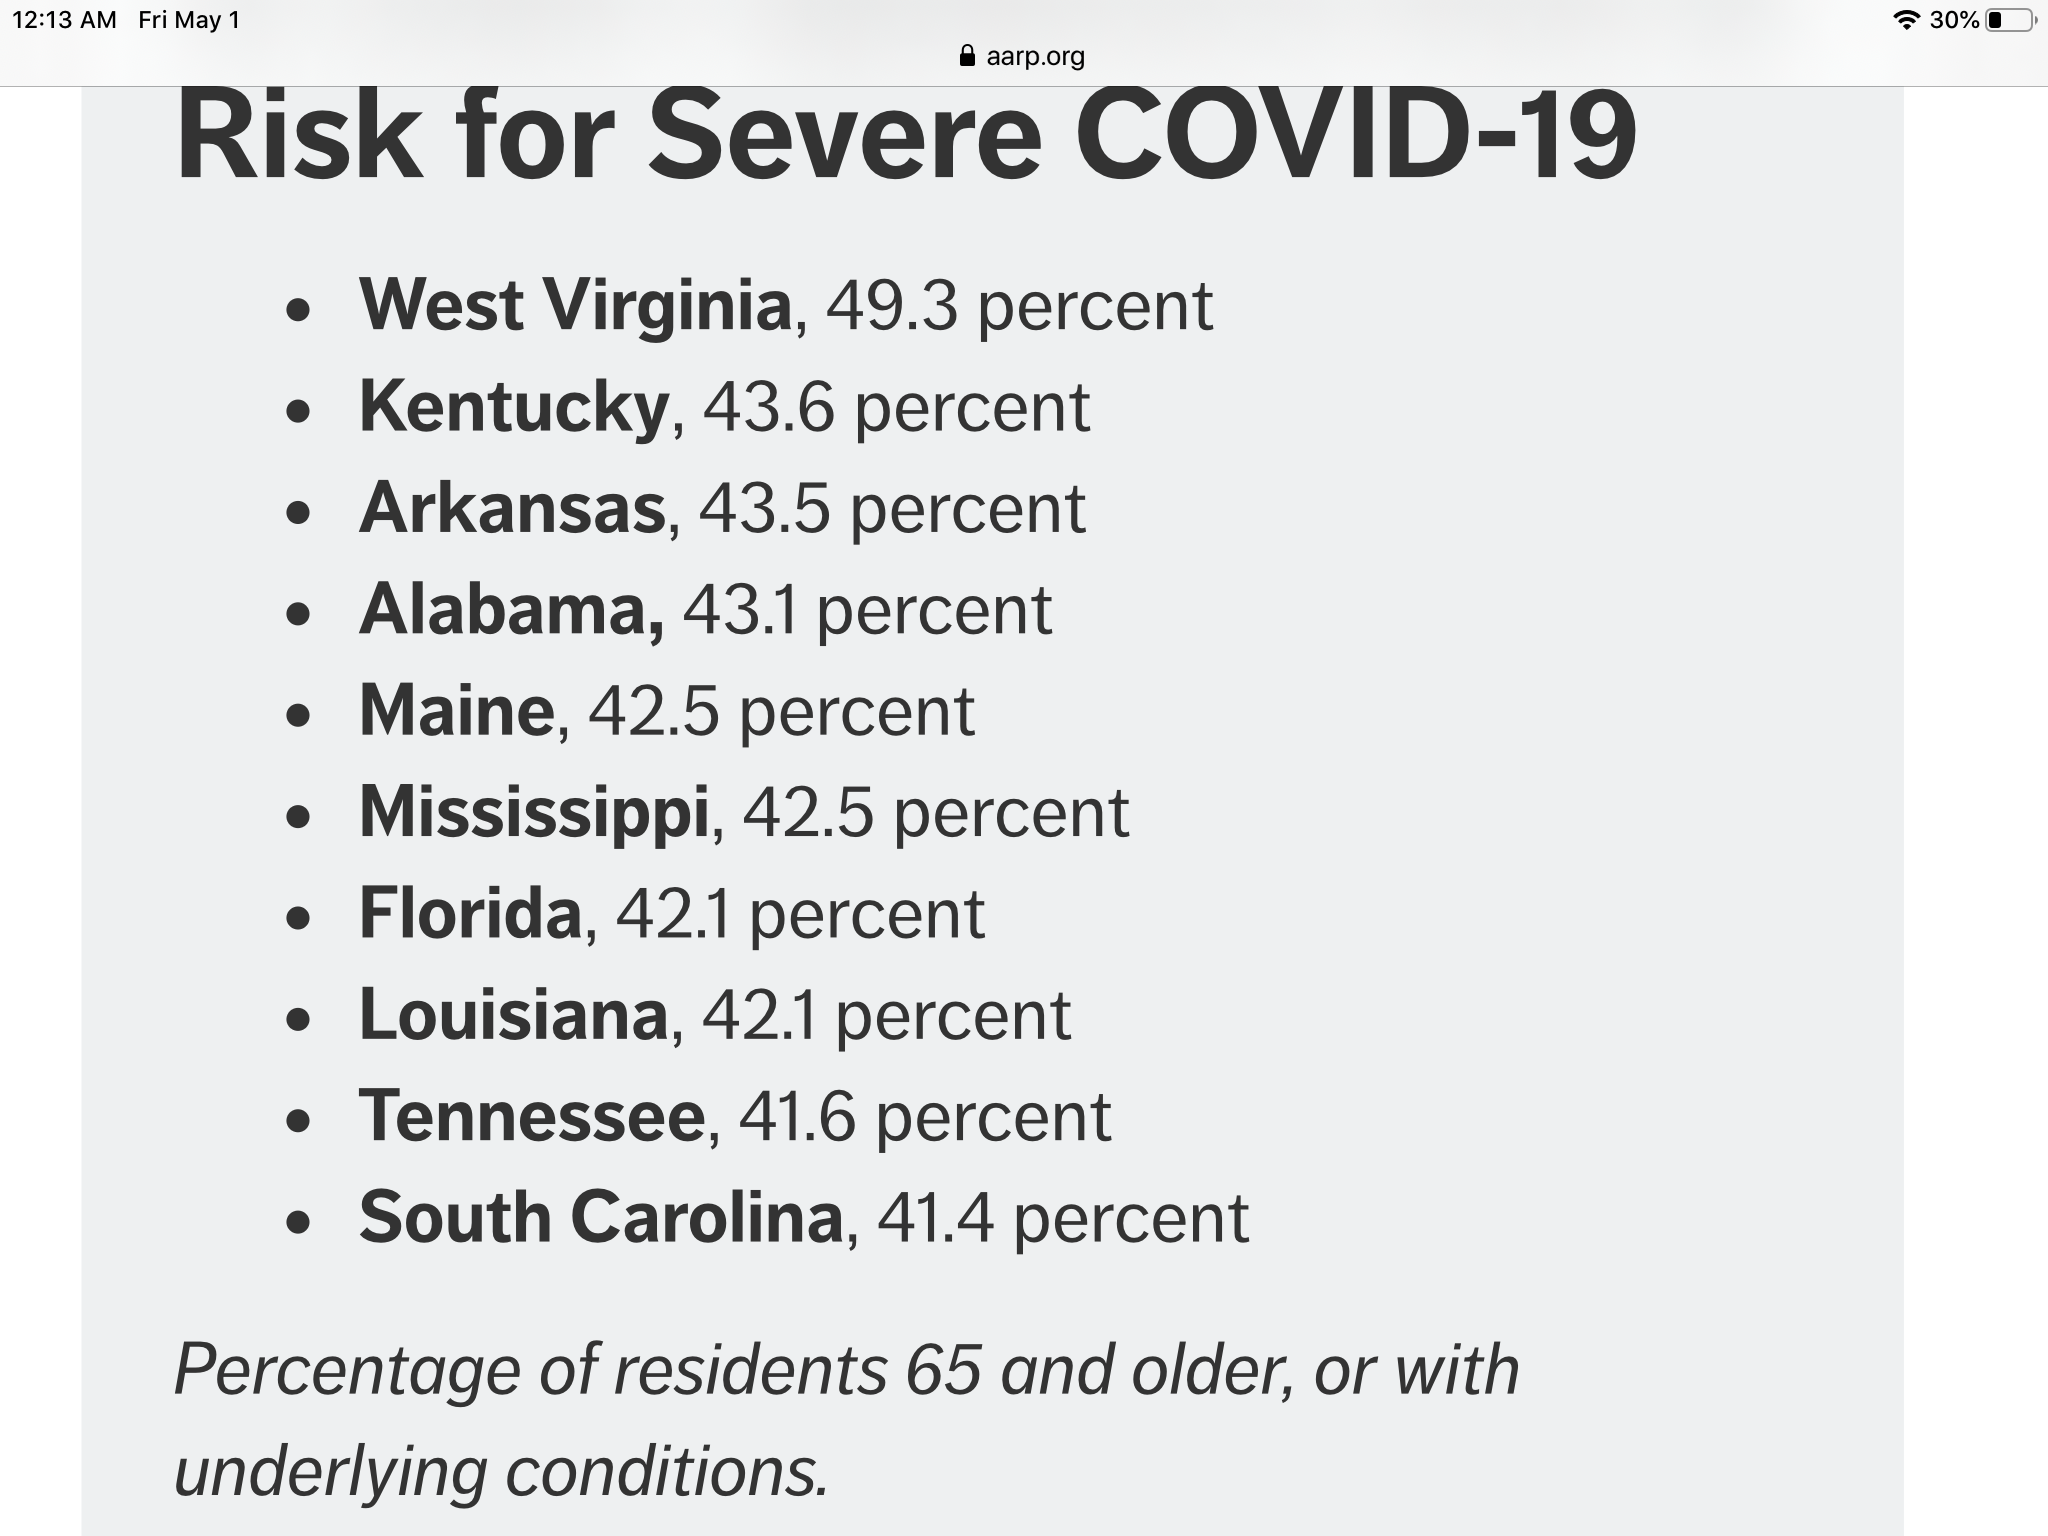
The KFF website also has a list of states and their separate percentages at risk.

The states with the greatest risk for Severe COVID-19 are shown below.

.

Table of Percent of All Adults at Risk, Adults at Risk in Millions, Share Under 65 at Risk, and  Share of All at-Risk Adults Over 65, for the most populous states.

State Percent Number Under 65 Over 65
CA 33.3 10.0 m 18.0 56.0
TX 34.8 7.2 m 21.4 48.8
FL 42.1 7.0 m 22.0 61.2
NY 36.9 5.5 m 20.4 56.1
PA 39.8 3.9 m 21.8 57.8
IL 36.2 3.5 m 20.2 55.3
OH 39.8 3.5 m 22.9 54.0
MI 41.2 3.2 m 24.7 53.2
GA 36.2 2.8 m 21.8 50.9

Poverty Rate:  NY13.6%; CA 12.8%; 

Uninsured Population:  NY 5.6%; CA 7.2%

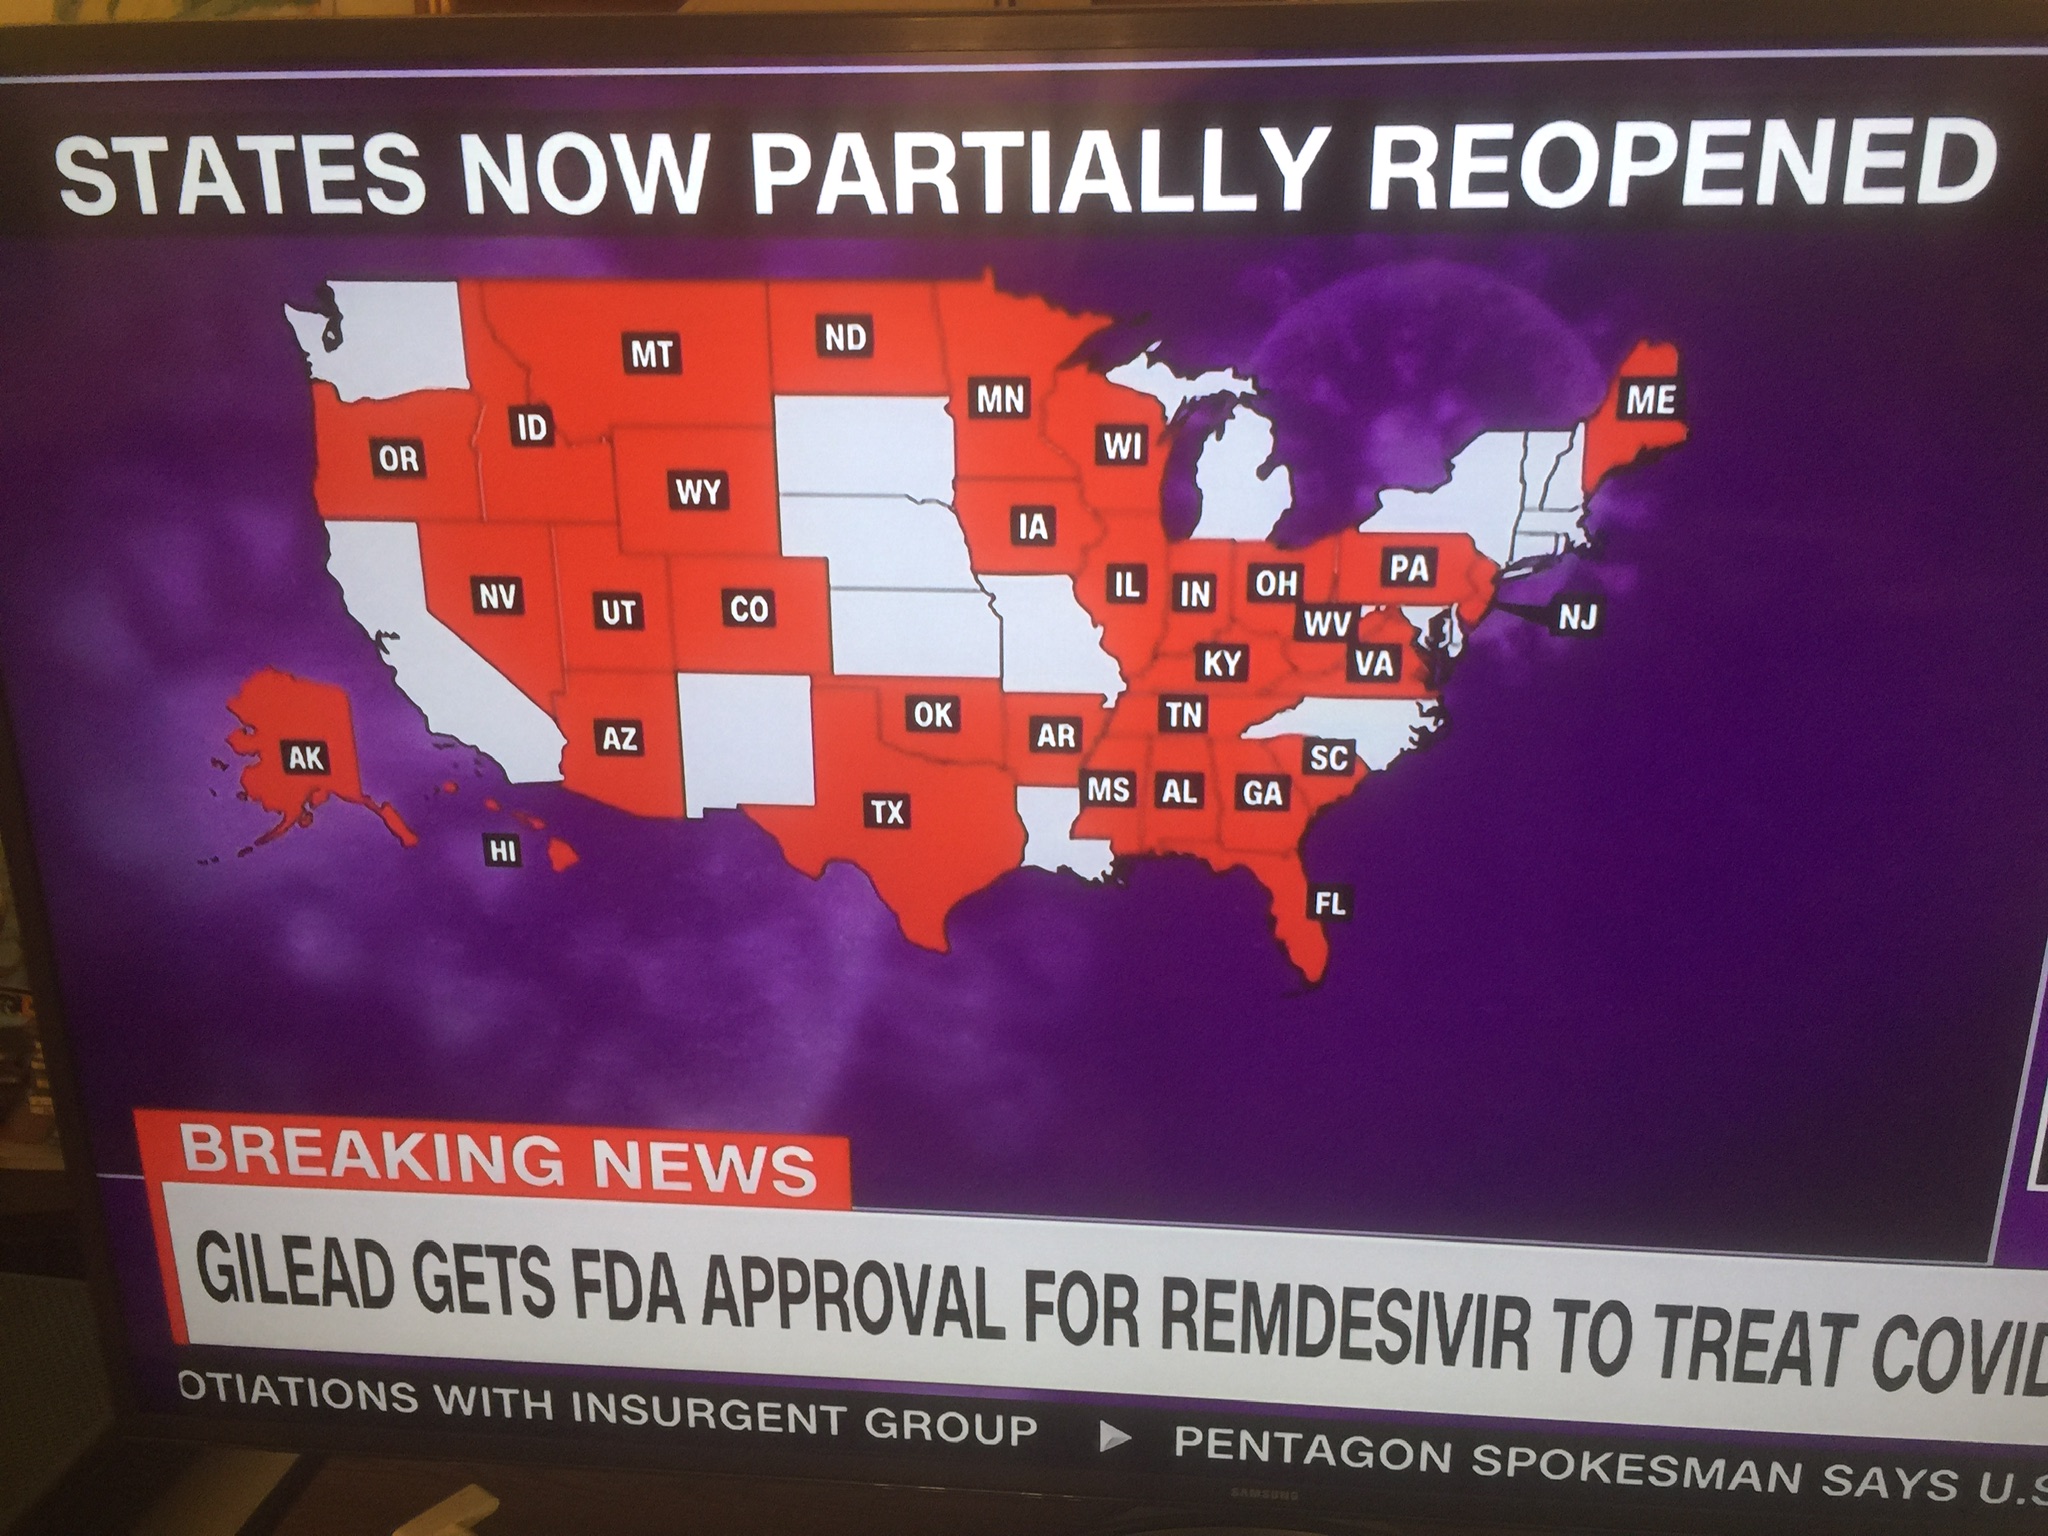
Here are the states which are starting to reopen as of today, May 1, by CNN’s accounting.  Other sources have some differences.


Posted in Coronavirus, COVID-19, Health Care | Leave a comment

April 30. Coronavirus and Obesity in US States

Age and Obesity are key factors in complications in Coronavirus infections.  Obesity is also associated with high blood pressure, heart disease, and diabetes, which are also Coronavirus complications.  We present the CDC map for obesity ranges of the various US States in 2018.

Among countries, the US has the highest Obesity percentage among fair sized states, of 36.2%.  This is a little off from this map, where the most populous states are below 35%.

The largest Democratic states are California at 40 million, and New York at 19 million.  Texas, at 29 million, and Florida at 21.4 million.  A lot of the 31 states relaxing stay-at-home restrictions this weekend are in the heavier Midwest states and Southern states.  States still on lockdown are on the West coast including Nevada and Colorado, and the Northeastern states surrounding New York, all of which are below 30% obesity.  However, the percent differences are not enormous.

Posted in Coronavirus, COVID-19, Health Care | Leave a comment

April 30. Obesity in Key Coronavirus Countries

Obesity is a key factor in high blood pressure, heart disease, and diabetes, which are the main vulnerabilities, along with age and obesity itself, for severe Coronavirus complications.  We list the percentage of the obese population in some key countries for Coronavirus approaches and infestations.

Country Obesity Percentage
United States 36.2
Canada 29.4
Mexico 28.9
United Kingdom 27.8
Spain 23.8
Russia 23.1
Germany 22.3
Brazil 22.1
France 21.6
Sweden 20.6
Austria 20.1
Italy 19.9
North Korea 6.8
China 6.2
South Korea 4.7
Japan 4.3
India 3.9

In addition, smoking and severe air pollution are also risk factors for complications.

Posted in Coronavirus, COVID-19, Health Care | Leave a comment

April 30. Coronavirus State Openings and Sweden

April 30.  Coronavirus State Openings and Sweden

By this weekend, 31 states will have controlled openings.  We will examine the wide range of projections for Sweden in the new IHME projections.

There are now 30 million having filed for unemployment insurance.  This is said to be almost 20% of the US workforce.  There are also those who don’t have steady jobs and can’t file for it, so there may really be 25% unemployed.  This is as bad as in the Depression.

Of the six IHME projection criteria, Sweden only satisfies one, namely, no large gatherings.  However, the vulnerable and elderly are supposed to isolate, which they know to do anyway.  Schools and businesses are still open.

The population of Sweden is 10.2 million, and Stockholm has about a million.  This is comparable to a lot of midsize states, which are opening.  Sweden is half the population of New York, and a quarter of that of California.

So far, there are 2,371 deaths in Sweden, as of April 28.  This is larger than those of its neighbors with stay-at-home restrictions, Norway with 206 deaths and 5.37 million population, and Denmark with 434 deaths and 5.8 million population, each about half of Sweden’s population.

The IHME model has a vastly larger projection of total deaths in Sweden of around 17,300, but with an enormous 95% probability range of from 2,900 to 76,000.  The projection of peak resource use does not come there until May 22, and the peak daily deaths is centered around May 22, when it is projected about 500 deaths per day, with a wide 95% range from 8 to 2,800 per day.

Trump is in charge of “Operation Warp Speed” to develop and produce a vaccine by next January.  This is very convenient.  He can claim that it is coming shortly just before the election.  But he doesn’t have to face the possible failure and mistrust if it actually came out before the election.   The trouble with rushed results, is that you bet on the first one, which may not be the best one in the end, and you may give up developing the other ones.  Another example of politics over science exploration.  Trump fired the experienced professional previously in charge of vaccine development, because he didn’t support Trump’s hydroxychloroquine mania.

There are several different approaches to vaccines, and two types of antibodies, ones that fight the virus during the infection, and ones that are produced later that may give immunity.  Maybe several vaccines will be needed, especially if each is not 100% effective.  The dosages required for the elderly and vulnerable may also be higher, as they are for other vaccines.  Plus, there may be protective medicines to take before infection.  So far, Remdesivir shortens hospital stays from 15 to 11 days, and may increase survivability.

Posted in Coronavirus, COVID-19, Donald Trump, Health Care, IHME Projections | Leave a comment

April 28. Sad Milestones, New Projections, and Testing and Tracing

April 28.  Lots of Sad Milestones, New Projections, and Testing and Tracing

In the last few days, the World crossed the three million case number, being 3.11 million tonight.  The US crossed the one million case number, at 1.01 million tonight.  So the US has one third of the world’s cases.

World deaths are 217,000, and US deaths are 58,335, or 27%.  Everybody agrees that actually infected people are many times those that needed to be tested.  Sadly, the US deaths above now exceed those of the Vietnam War, of 58,220 US deaths.  Almost 40,000 Americans died in the Korean War.

The IHME has new projections today, which has US total deaths by the end at 72,860.  The 95% upper probability is 122,000.  This has accounting fo rather states relaxing restrictions before meeting Trump’s or the IHME criteria.  The US fit is 9 days past the peak resources, and 13 past peak daily deaths.

The Harvard Road Map for Testing for restarting is 5 million tests a day, and 20 million a day by midsummer.  So far, the White House plans are only 6-7 million tests a month.  The cost involved is $46.5 billion.  This is broken down as follows.  The cost for 180,000 workers to trace and contact is $12 billion.  The cost to isolate contacts in hotels is $4.5 billion.  The cost for 18 months of support is $30 billion.  While it sounds like a lot, the $46.5 billion is only 2% of the $2.5 trillion bailout budget.

Oxford is claiming that they can have a vaccine by this fall.  But Fauci still wants the full year and a half for testing.  One can imagine Trump endorsing and producing the vaccine long before conventional testing is done.  The question is, who would take it then?

This is the map of states starting up now with separate rules in green, yellow ones start up in early May, and red ones stay locked down.

Colorado and Nevada have joined the west coast states of California, Oregon, and Washington in a coordinated group.

We present tables of a few large states which are not relaxing their stay at home programs, and of a few states which are.  We present the projected and present deaths.  The states keeping the restrictions are relatively near their final projections, while the relaxing states are projected to double their present deaths, which are taken as of April 27th.

States Keeping Restrictions:

State Projected Deaths Present Deaths
New York 24,088 21,928
New Jersey 7,051 6,044
Massachusetts 5,633 3,003
Michigan 3,818 3,407
Connecticut 3,366 2,012
Pennsylvania 2,318 1,886
Illinois 2,292 1,983
California 2,035 1,779
Louisiana 2,032 1,740

States Relaxing Restrictions:

State Projected Deaths Present Deaths
Georgia 2,259 995
Florida 1,921 1,088
Texas 1,447 666
Colorado 1,052 706
Kentucky 517 220
Mississippi 380 229
South Carolina 351 177
Wisconsin 331 281

As Sanjay Gupta pointed out, the infection probability is not just stopped by a six foot separation, but it depends on how long one is exposed in an enclosed room.  Hence, hair cutting and gyms are scary to me.  It’s different from passing someone in the market. 

California has now developed more data on how minorities are more affected by the Coronavirus, in given age groups, since Latinos are younger than whites.  In the age group 18 to 49, Latinos make up 64.9% of the deaths, while being 43.5% of the population.  African Americans made up 15.3% of deaths in that age group, while being 6.3% of the population.

While Trump has been blaming China for covering up the initial infection, Trump also cut our C.D.C. Delegation in China from 47 to 14 before the pandemic began.  We really have to stay and contribute to the W.H.O. In order not to make similar mistakes again.

As we speculated from previous small business programs, much of the small business loans went to large businesses.

Posted in Coronavirus, COVID-19, Health Care, IHME Projections | Leave a comment

April 27. “Consider Yourself” Coronavirus Watered Down Guidelines

April 27.  “Consider Yourself” Coronavirus Infected

One thing I have to be thankful for is that Trump did not waste four hours of my weekend giving his televised self-praising, press bashing, repetitive, and babbling election rallies posing as a Task Force Report.  The next thing is that he may be done with them (I doubt it).

The sensible people left in his administration have drafted detailed guidelines for how businesses, recreation, and churches could reopen safely.  However, these are being watered down with the word “consider” in every sentence.  I was pretty sure that the President could not wipe out the liability or legal responsibility of businesses from infecting workers or customers, just by adding his squiggly signature to a document.  But watering down government requirements or even standards by adding “consider” effectively could do that, especially in one of the new “Trump Courts of Law”, of his appointed judges.

My title, “Consider Yourself” comes from the only other document which is rife with “considers”, the song “Consider Yourself” from the musical “Oliver!”, written by Lionel Bart.  It is sung by the gang of thieves who are recruiting Oliver, which is apropos here.  Some choice lines from the lengthy repetitive song:  “Always a chance we’ll meet, Somebody, To foot the bill”.  Trump’s name on the checks, doesn’t mean he is paying for them.  We the taxpayers are.  “Consider yourself … One of us!!” Is the flat out election year ploy of letting the aid checks appear to come from Trump himself.

As another proof of Trump’s compulsive Narcissism, Trump not only has his name on every government handout check, but has now added his signature to every accompanying letter which has to be sent.  When is he going to put his picture on the $100 bill, or the $20, or a lesser one, or all at once?  And pictures of Mar-a-Lago and Trump Towers or Casinos on the backsides.

The White House gang who edited in “consider” is probably the same gang who removed “climate change” from all Trump administration documents and websites.  They have also purged the WHO references and links this week.  Who is next? Who is next to be blamed for the US Coronavirus folly?

The very successful musical “Oliver!” Was based on Charles Dickens novel “Oliver Twist”.  Lionel Bart also wrote the theme song for the 1963 James Bond movie “From Russia With Love”, which is also strangely apropos for the Trump administration.

Posted in Coronavirus, COVID-19, Donald Trump, Health Care | Leave a comment

April 25. More Coronavirus Data, and Openings

I watched the National Academy of Sciences panel talks with experts on the COVID-19 health crisis.  Dr. Fauci and Sanjay Gupta of CNN gave talks.  It should soon be on YouTube.  I screen captured 56 of the slides, which are on my Flickr account album.

This is the graph of US cases, and deaths.

Adding to the New York City hospital chain study reported on yesterday, of those admitted to hospitals, nearly all had at least one major chronic health condition, and 88% had at least two.  The main conditions were obesity, high blood pressure, and diabetes.  Only 6% had no underlying health conditions.

Strokes in NY City from blood clots are up a factor of seven, and those people were found to have the Coronavirus.  The Coronavirus also causes kidney disease, and lumps on toes.  Raised temperatures only appeared in 30% of cases of people being hospitalized.  So screening patrons to businesses for raised temperature is necessary, but not sufficient.

As far as the public goes, in California, 75% want to continue the statewide stay-at-home order as long as needed.  Nationwide, 78% think that moving too fast is a greater threat than moving too slowly.  86% think that social distancing and stay-at-home orders are responsible policies.  That includes 82% of Republicans.

Here is the map of states with stay-at-home orders expiring by April 30, five days from now.

I’m trying to concentrate on the health aspect of the Coronavirus, and laying off of politics, but I had to find out what kind of a governor Brian Kemp of Georgia was.  As appointed and then elected Secretary of State of Georgia, he went over and above the usual Republican strategy of suppressing minority votes.  He lost many court cases with his illegal strategies.  He didn’t even resign from that oversight while running for governor.  He won that race by a mere 1.4%.  He studied agriculture in college.  He also represented the massage industry.  As governor, he fought the Affordable Care health act.  He refused to expand it to Medicaid coverage.  He has really no concern for healthcare for his state.  Even though in charge of elections, he rejected our intelligence that Russia had interfered in the 2016 election.  Which is probably why Trump backed him.  This is all described in detail in Wikipedia.  That is the background to the governor who is starting up the most viral-spreading personal contact industries in his state.  Who knows if he is keeping track of the upsurge in cases that will occur in a week, and could easily be traced to such contacts?  The patrons to the barber shops were not wearing face masks.  There are now automatic license place readers, and it wouldn’t surprise me if other states may try to ban those with Georgia license plates.  Georgians could even be placed on the do-not-fly list, if there is a breakout.

An official from Florida said that there were 16.5 times as many people infected with the Coronavirus there as had been tested positive.   Florida is going to reopen parks, marinas, and golf courses, which I agree with, but I’m not sure what kind of businesses they are opening.

It was pointed out that the W.H.O. Also covers malaria and other world diseases, which the United States has to be protected from.   The US contributes about $550 million a year to the W.H.O., which is about 25% of its budget.

Posted in Coronavirus, COVID-19, Donald Trump, Health Care | Leave a comment

April 24. We Learn More About the Coronavirus

Worldwide Coronavirus deaths is almost at 200,000.  The US has passed 50,000 deaths.

The Vice President said that he had a list of 16 states that were starting to loosen restrictions.  I’m going to discuss five now, and along with the seven I gave the preferred restart dates for yesterday, makes up 12 of them.

Today, the IHME site had a date for when Georgia reached only one case per day per million, and that is a late June 22.  So they are opening two months early.

Four more are Missouri on June 10, Pennsylvania on May 27, Oregon on May 27, and Idaho on May 16.

Sweden, which doesn’t have a lockdown, is projected to have an IHME release date of June 22.  They are projected to have about 10,600 deaths within a very wide range.  With 20.2 million population, about the size of New York State, the final death rate would be 0.05% of the population.  I’m guessing that very old and vulnerable people would confine themselves anyway.

On the New York City data from yesterday, with some approximations since I didn’t have the dates and stats for the days on which they did the testing, I estimated that the number who had had the virus, compared to those tested positive with the virus, was a whopping 150.  This beats 50-85 in San Jose, and 40 in Los Angeles.  I hope that they release an official number on this in New York City.  I don’t trust my value that much, so don’t quote me.

In New York State’s largest health care system, the fatality rate was 20% of those hospitalized.  Of those who died, 57% had hypertension, 41% were obese, and 34% had diabetes.  Asthma did not play a role.  Of those admitted, 70% did not have a fever, in contrast to that being the main indicator, by the CDC.

In that system, before COVID-19, of those who needed to be on ventilators, 80% died.  With COVID-19, that rose to 88%.

In China, 44% of the cases were passed on before symptoms appeared.

Today’s New York new COVID hospitalizations per day are about a third of what they were at the peak, and have been below the peak for 19 days.  They would qualify for Trump’s transition to phase I, but you can see that the drop off is very slowly.

The Trump administration is bragging about how many and how fast they can get Coronavirus testing approved.  The testing companies are responsible for self verifying their tests, and they aren’t accurate.  The FDA has only approved four tests.  They are bypassing the FDA with its $3.16 billion dollar budget, of which 22% is for Human Drugs.  They have 17,500 employees.

Posted in Coronavirus, COVID-19, Health Care, IHME Projections | Leave a comment

April 23. Summertime Kills the Coronavirus

“It’s summertime, summertime, sum, sum, summertime” the Jamies.

”Summertime, and the living is easy”, Porgy and Bess, by George Gershwin.

No less than the Department of Homeland Security has shown that the Coronavirus is destroyed by sunlight, with a two minute half life on a lit surface.  The aerosol is also destroyed with a 1.5 minute half-life.  Here is my reliable source:

These aren’t identical radioactive particles decaying with equal probabilities, with an exponential decay curve.  The drops or aerosols have a finite size and dry up or are destroyed from the outside in.  Since only a few virus cells can spread it, you really have to know how long the aerosols or droplets last totally, which depends on their size.

The U. Washington IHME team (Institute of Health Metrics’s and Evaluation) has a slightly changed map but the same data date as yesterday.  This is their prediction of when the number of new daily cases is projected to fall to one per million of population.  Here is the map.

We now examine states partly opening this weekend or on Monday.  Texas and South Carolina, are projected to be free on June 8.  New York is projected for May 27.  Tennessee (May 20), Mississippi (May 29), Ohio (May 14), and Colorado (May 26) are also opening some businesses next week.  Georgia doesn’t have a prediction on the IHME website, but is June 8 or later on the map.  California is not opening now, but is projected to be free on May 10.

New York Gov. Cuomo preliminarily released the antibody testing for New York areas, showing that in New York City, the fraction with antibodies was 21.2%.  Long Island had 16.7%, and Westchester/Rockland had 11.7%.  The rest of the state had 3.6%.  Knowing the number of deaths, they figured that the mortality rate was 0.5%, which is a factor of 10 less than the obvious fraction of deaths to confirmed cases of 5.6%.  So 0.5% is both good, but also bad as it is 3 to 5 times the death rates for seasonal flus.

About equal numbers of men and women were tested statewide around grocery stores, but viral men were 16%, and women 12%.  The overall statewide rate is 14%.  Seniors 65-74 were 11.9%, and elders over 75 were 13%.  Other decadal percentages starting at 25-34 were even higher, giving 15.9%, 13.6%, 16.7%, and 14.9%.  Younger people are out working and getting around, so they are more vulnerable.

Modelers at Northeastern University have figured that on March 1, there were actually on the order of 10,000 infected in both New York and San Francisco, 3,000 in Chicago, and 2,000 in Boston and Seattle.

Posted in Coronavirus, COVID-19, Health Care, IHME Projections | Leave a comment

April 22. It’s All About Coronavirus Reopening

April 22.  It’s all about Coronavirus reopening.

Using the IHME model, CNN has made a map of the reopening dates of the 50 states, which we show below.  The different color bins are for weeks of opening starting May 4-10 in dark Green, May 11-17 in medium green, May 18-24 in light green, May 24-31 in bright yellow, June 1-7 in medium yellow, and after June 8 in dark  yellow-brown.  California is in the May 11-17 group.

I’m going to add a clearer version here, but its earlier two date groups are two weeks in length.  Since the IHME uses a given error function curve to fit the data which is close to other countries more advanced in the infection, it is not really 100% predictive.  In any case, data fluctuates for many reasons.  Their criteria is to get down to one new case per million per day.  Nobody is going to wait that long.  If you have a team to do contact tracing of 100, say, you probably could stop at 20 new cases per day per million.  The model assumes that every state and every person is isolating.  People travel, and as states open early, the virus will start respreading. The Las Vegas Mayor wants to open, regardless.  Since it is a major tourist spot, it could send new cases all over the country.  New York is in the May 18-31 category.  Georgia is after June 8.  Trump disagrees with the Governor of Georgia, Brian Kemp, opening up now.  But he is letting him make his decision.

A 2007 paper in the Journal of the AMA, JAMA, traced the number of cases and histories of major US cities in the influenza pandemic of 2018-19.  It shows second waves in cities that did not lock down long enough. I’m just going to show one graph from the paper itself, that compares the history of three sectors of the US.  The complications this fall will be having both the flues and the Coronavirus cases impacting our public health facilities.  Dr. Robert Redfield, CDC Director, really want’s us to take the flu vaccine, and I want all to take the pneumonia vaccines.

All three had a late surge or second wave, but the West Coast, shown by circles in the curve, had the worst.  National Geographic showed curves for separate cities.

The 1918 pandemic was called the “Spanish Flu” since that was the only country not censoring its occurrence during the First World War.  (Sounds familiar.)  It is not known where it started.  It was an H1N1 flu virus.  Many people died from ordinary pneumonias, which we now have vaccines for, as well as for different H1N1 viruses each year.  The strategies used then were closing schools and theaters, closing churches, and banning gatherings.

The JAMA paper estimated total US deaths at 500 per hundred thousand, or 1 death per 200 people.  At present, the US has 45,153 deaths, out of a population of 320 million, which is 14 per 100,000, or 1 death per 7,000 Americans.  In the 1918 flu, New York City had 452 deaths per 100,000.  The Coronavirus in New York City now has 170 deaths per 100,000o.  In 1918, Los Angeles had 494 deaths per 100,000 people.

The JAMA paper is Aug. 8, 2007, Vol. 298, No.6, pp 644 -656 , by Dr. Howard Markel et al.

The much touted 15 minute (10 minute, 5 minute) test by Abbott labs, turns out to give 15% false negatives.  This is used to test everybody who has contact with the President.


Posted in Coronavirus, COVID-19, Health Care, IHME Projections | Leave a comment